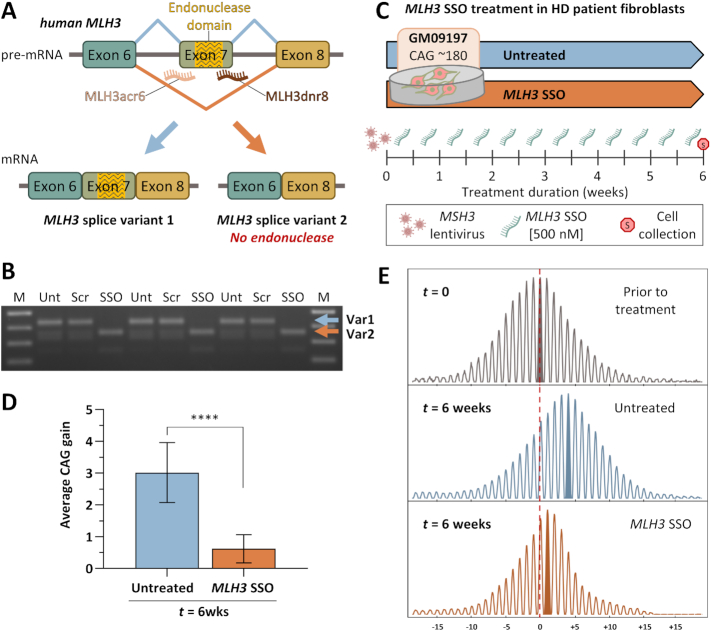
Figure 3.
Successful MLH3 splice redirection and suppression of HTT CAG expansion in HD patient-derived fibroblasts following treatment with MLH3 SSOs. (A) Schematic representation of human MLH3 splice redirection with splice switching oligonucleotides (SSOs) (adapted from Halabi et al. 2018 (28)). SSOs were designed to bind the intron–exon junctions in human MLH3 pre-mRNA at either the splice acceptor (MLH3ac6) or donor (MLH3dnr8) regions of the endonuclease-coding exon 7, inducing exon skipping and preferential production of MLH3 splice variant 2, which lacks the endonuclease domain. (B) RT-PCR analyses of MLH3 mRNA splice variants in HD patient-derived primary fibroblasts (GM09197, CAG ∼180/18) following treatment with 500 nM of either scrambled control vivo-morpholino oligonucleotide (Scr) or MLH3 SSOs (SSO) for 48 hours, alongside untreated controls (Unt) (n = 3 per condition). Splice redirection from predominantly splice variant 1 (Var1) to predominantly splice variant 2 (Var2), which lacks exon 7 and the endonuclease domain, was efficiently achieved with MLH3 SSOs treatment. No splice redirection was observed in scrambled oligo-treated cells, which were identical to untreated cells. (C) In order to induce CAG expansion in HD patient fibroblasts (GM09197, CAG ∼180/18), cells were initially treated with lentiviral particles for stable ectopic expression of MSH3. Cells were then cultured to confluency, to inhibit replication, and treated twice weekly with 500 nM of MLH3 SSOs (MLH3acr6 and MLH3dnr8, 1:1 ratio, 250 nM each), or left untreated, for a total of six weeks when cells were harvested for HTT CAG instability analysis. (D) Quantification of average HTT CAG gain during the 6-week-long treatment (relative to average CAG prior to treatment, ‘t = 0’, n = 4) reveals a potent inhibition of CAG expansion by MLH3 SSOs (average gain of 0.6 CAGs, n = 10), when compared to untreated cells (average gain of 3.0 CAGs, n = 10). Error bars represent standard deviation of the mean; one-way ANOVA with Tukey multiple comparisons post hoc correction; ****P < 0.0001. (E) Representative GeneMapper traces of HTT CAG repeat size distributions from GM09197 HD patient fibroblasts before (t = 0) and after (t = 6 weeks) treatment with MLH3 SSOs (CAG gain = 0.7), or no treatment (CAG gain = 3.6). CAG change from modal allele at t = 0 is represented on the x-axis.

