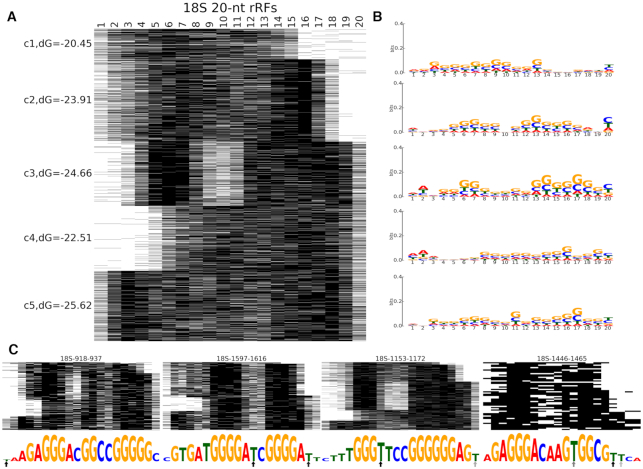
Figure 4.
Clustering of 20-nt rRFs from 18S rRNAs reveals potential binding modes. (A) Base-pairing patterns of the 20-nt rRFs in 4603 unique rRF-target interactions. (B) Sequence logos show the nucleotide composition patterns for unique rRF isoforms in every cluster. (C) Base-pairing patterns of four 18S rRFs with the most interactions with different target genes. Sequence logos below show the frequency of hybridization with the target at each rRF position. The arrows show the frequency (darker shade being more frequent) of T→C conversions in PAR-CLIP data (see section E).

