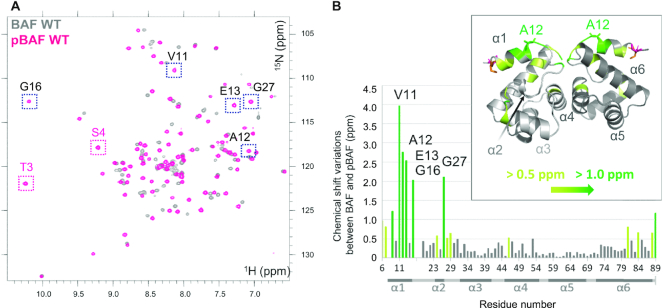
Figure 2.
Phosphorylation by VRK1 significantly modifies the 1H–15N HSQC spectrum of BAF in solution. (A) Superimposition of the 1H–15N HSQC spectra of BAF before (grey) and after (pink) phosphorylation by VRK1. These spectra were obtained at pH7.2, 30°C and 700 MHz. Assignment of the 1H,15N NMR chemical shifts of pBAF revealed that the peaks corresponding to Thr3 and Ser4 (boxed in pink) are found in a spectral region typical for phosphorylated residues. (B) NMR chemical shift variations due to phosphorylation by VRK1. From the analysis of the NMR spectra displayed in (A), chemical shift variations due to phosphorylation were calculated for each residue, using the equation: . Bars corresponding to residues 2–5 are not shown because peaks corresponding to these residues were not observed on the BAF spectrum at pH 7.2 and 30°C. Chemical shift variations larger than 0.5 ppm and 1.0 ppm are indicated in yellow-green and green, respectively. A set of residues, including Ala12 mutated in NGPS (4,49), show variations larger than 2.0 ppm: they are boxed in black on the pBAF NMR spectrum in (A) and marked on the bar graph in (B). A 3D view of the chemical variations due to phosphorylation is inserted. In this picture, the 3D structure of non-phosphorylated BAF (PDB: 6GHD) was used to position the residues with large chemical shift variations due to phosphorylation by VRK1. Thr3, Ser4 and Ala12 are represented with sticks and Thr3 and Ser4 are in orange and pink, respectively. Other colors are as in the bar graph.

