Figure 4.

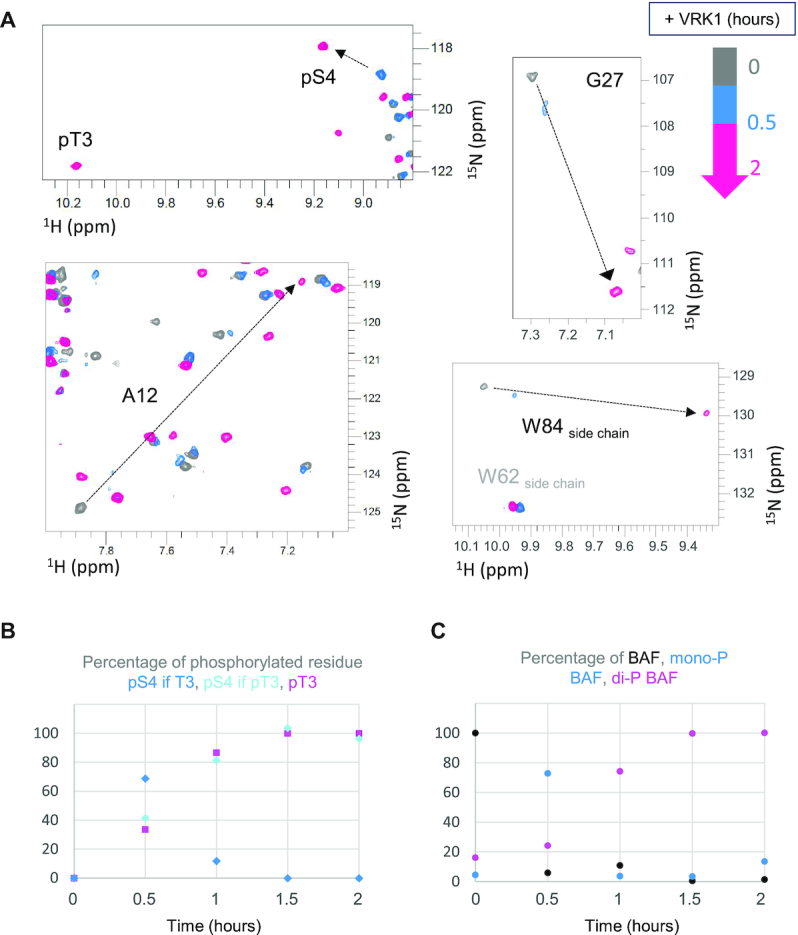
Real-time NMR monitoring of BAF phosphorylation. 2D NMR 1H–15N HSQC spectra were recorded every 30 min after addition of VRK1 at pH7.2, 30°C and 700 MHz. (A) Four selected zoom views from the superimposition of the spectra acquired at 0 (grey), 0.5 (blue) and 2 (pink) hours. The black arrows identify peaks largely shifted due to phosphorylation. (B) Percentages of phosphorylation as a function of time deduced from the intensities of the peaks corresponding to pThr3 and pSer4. Whereas this percentage is close to 100% at the end of the kinetics for pThr3 and pSer4 in the final di-phosphorylated BAF species (cyan and pink curves), it increases up to 75% and then decreases down to 0% in the case of pSer4 in the intermediate, mono-phosphorylated BAF species. (C) Percentages of BAF, mono-phosphorylated BAF and di-phosphorylated BAF, as a function of time. Here, the phosphorylation kinetics was monitored from the intensities of the peaks corresponding to selected residues, i.e. Ala12, Gly27 and the side-chain of Trp84. These peaks are largely shifted upon phosphorylation, as shown in (A). Three positions can thus be observed for each of these peaks, corresponding to BAF, monophosphorylated BAF and di-phosphorylated BAF. The peak intensities were followed at each of these positions with time, translated into percentages and averaged upon the three residues.
