Figure 5.
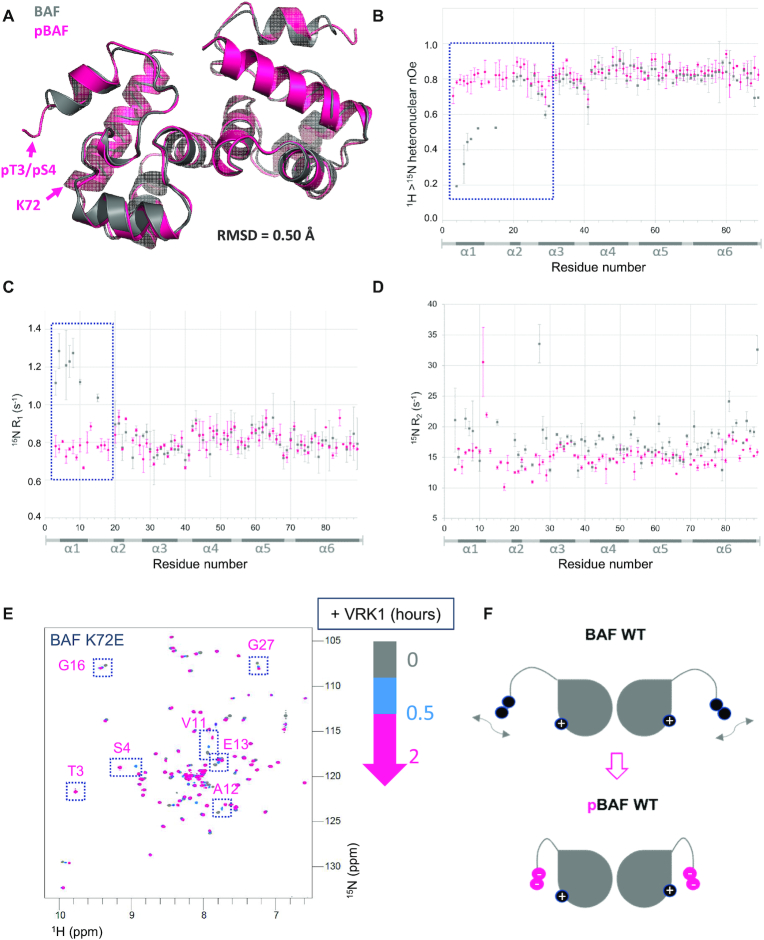
BAF and pBAF share similar 3D structures but exhibit different dynamics in solution. (A) X-ray structure of BAF phosphorylated by VRK1, superimposed onto the structure of non-phosphorylated BAF. Both structures are displayed as cartoons, pBAF being colored in pink and BAF (6GHD) in grey. The positions of pThr3, pSer4 and Lys72 in pBAF are indicated; their side chains cannot be unambiguously positioned in the electron density of pBAF due to lack of resolution. The specified RMSD value was calculated between all atoms of BAF and pBAF. The statistics of the pBAF structure are presented in Supplementary Table S1. (B–D) 15N relaxation data recorded on BAF and pBAF as a function of the residue number. 15N R1, R2 relaxation rates and 1H→15N nOe of BAF and pBAF, recorded at pH 7.0, 293K and 700 MHz, are displayed in grey and pink, respectively. Regions in which large differences are observed are highlighted by dotted boxes. (E) NMR monitoring of the phosphorylation kinetics of the BAF variant K72E. The 1H–15N HSQC spectra recorded at 0, 0.5 and 2 h after addition of VRK1 are displayed in grey, blue and pink, respectively (as in Figure 4A). Peaks that largely shifted due to phosphorylation in BAF WT (see Figure 2A) are boxed. (F) Model highlighting how the flexibility of region from amino acid 1 to amino acid 18 in BAF (before Pro19) is reduced in pBAF due to electrostatic interactions between the phosphorylated residues and residues from helix α6 including Lys72.

