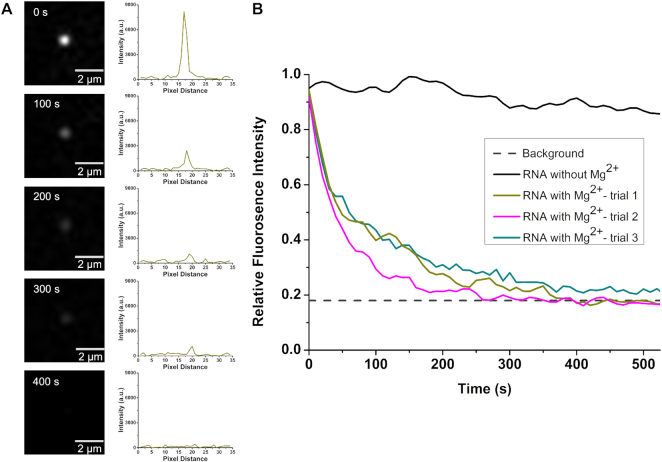
Figure 5.
Digestion of SYTO 82 labeled DMD RNA by immobilized XRN1. (A) Fluorescence still images and corresponding intensity plot profiles of labeled DMD RNA-immobilized XRN1 complex acquired at different times, after introduction of Mg2+ to initiate digestion. (B) Relative fluorescence intensity of RNA–enzyme complexes with time. The black spectrum depicts the intensity of the complex in the absence of the cofactor Mg2+. The dark cyan, dark yellow and magenta spectra illustrate the fluorescence intensity of the complexes when Mg2+ is introduced. The average fluorescence intensity becomes indistinguishable from the background intensity ∼400 s.

