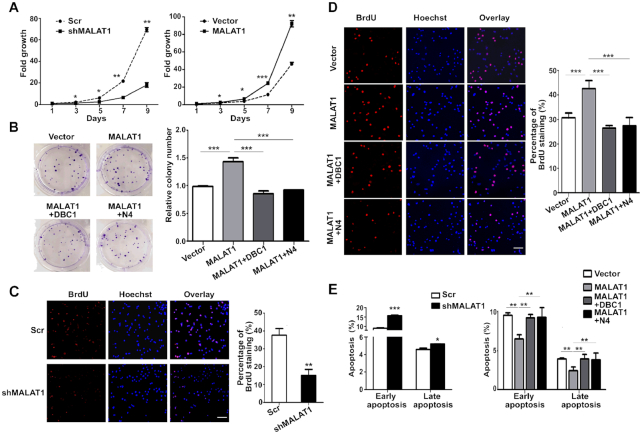
Figure 5.
MALAT1 regulates cell proliferation and apoptosis in HepG2 cells through binding with DBC1. (A) The growth curve of MALAT1-downregulated cells (left panel) and MALAT1-overexpressed cells (right panel) over 9 days. Cells (2 × 10⁵) were seeded in each well, and the cell numbers were counted every 48 h. Data are from three independent assays. Bar, mean; error bar, SD (*P < 0.05, **P < 0.01, ***P < 0.001, by repeated measures ANOVA). (B) Colony-formation assay of HepG2-MALAT1 and HepG2 cells co-transfected with both MALAT1 and DBC1 or DBC1-N4. Representative images show the results of the colony-formation assay (left panel). Histogram shows the relative colony numbers (right panel). Data are from three independent assays. Bar, mean; error bar, SD (***P < 0.001, by one-way ANOVA). BrdU incorporation analysis of MALAT1-knockdown HepG2 cells (C) and MALAT1-overexpressing cells with or without the overexpression of full-length or N4 fragment of DBC1 respectively (D). Representative images showing alterations in S phase distribution (left panel). Histogram shows the percentage of BrdU staining (right panel). Data are from three independent assays. Bar, mean; error bar, SD (**P < 0.01, ***P < 0.001, by Student's t-test or one-way ANOVA). (E) Annexin V assay for analyzing cell apoptosis in HepG2 cells transfected with shMALAT1 plasmid (left panel) or MALAT1-overexpressing plasmid with or without co-transfection of full-length or N4 fragment of DBC1 respectively (right panel). Data are from three independent assays. Bar, mean; error bar, SD (*P < 0.05, **P < 0.01, ***P < 0.001, by Student's t-test or one-way ANOVA).

