Figure 2.
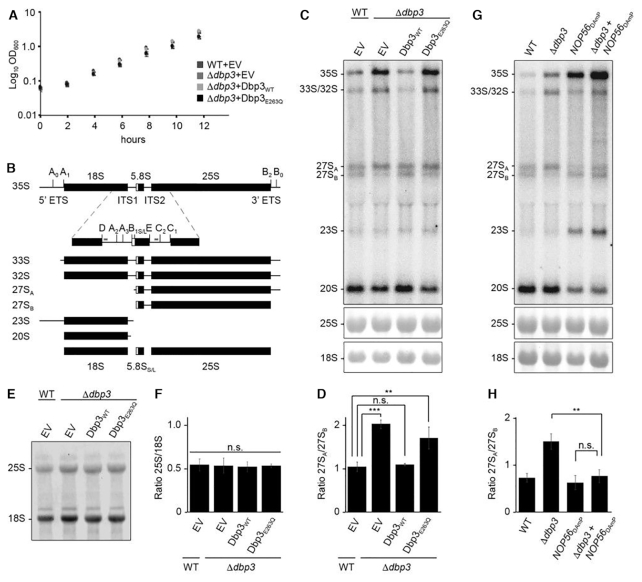
The role of Dbp3 in processing of the 27SA–27SB pre-rRNAs is linked to box C/D snoRNPs. (A) Wild type yeast (WT) or a strain lacking Dbp3 (Δdbp3) were transformed with an empty pRS415 vector (EV) or plasmids for the expression of Dbp3WT or Dbp3E263Q from the endogenous DBP3 promoter. Growth of these strains in exponential phase was monitored by measuring the OD of cultures at 600 nm every 2 h. The data represent the mean of three independent experiments ± standard deviation. (B) Schematic view of the major pre-rRNA processing intermediates present in yeast. Black rectangles indicate mature rRNA sequences and black lines represent internal transcribed spacers (ITS1 and ITS2) and external transcribed spacers (5′ ETS and 3′ ETS). The positions of selected pre-rRNA cleavage sites are marked on the 35S pre-rRNA transcript. A magnified view of the ITS1 and ITS2 regions with major pre-rRNA cleavage sites and the hybridisation positions of probes used for northern blotting (indicated by grey lines) is shown below the 35S transcript. (C) Pre-rRNA levels in the strains described in (A) were analysed by northern blotting using a mixture of probes hybridising within ITS1 or ITS2. Mature rRNAs were visualised by methylene blue staining. (D) The ratio of 27SA/27SB in the samples shown in (C) was calculated in three independent experiments and is shown as mean ± standard deviation. Significance was calculated using a Student's t-test (**P< 0.01, ***P< 0.001, n.s. = non-significant). (E) The strains described in (A) were grown in the presence of 4sU and nascent RNAs were labelled with biotin, separated by denaturing agarose gel electrophoresis and detected with fluorescently labelled streptavidin. (F) The ratio of 25S/18S in the samples shown in (E) was calculated in three independent experiments and is shown as mean ± standard deviation. Significance was calculated using a Student's t-test (n.s. = non-significant). (G) Pre-rRNA processing in wild type yeast (WT), cells lacking Dbp3 (Δdbp3), cells expressing reduced levels of Nop56 (NOP56DAmP) or both (Δdbp3-NOP56DAmP) was analysed as in (C). (H) The ratio of 27SA/27SB in the samples shown in (G) was calculated in three independent experiments and is shown as mean ± standard deviation. Significance was calculated using a Student's t-test (**P< 0.01, n.s. = non-significant).

