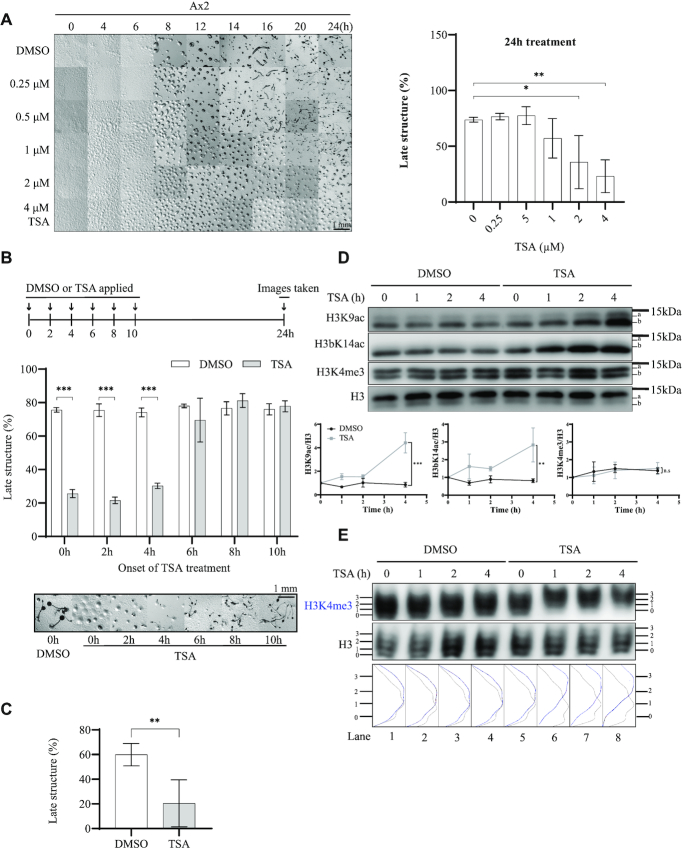
Figure 1.
Early exposure to TSA inhibits late development of Dictyostelium and results in H3K4me3-directed H3 hyperacetylation. (A) TSA inhibits late development of Dictyostelium. Left panel, exponential Ax2 cells were collected, washed twice with KK2 and allowed to develop on 1.5% (w/v) agar (1.5 × 10⁶ cells/cm2) containing increasing concentrations of TSA (0–4 μM). Images were taken at indicated times and representative images of three repeats presented. Right panel, The percentage of late structures (beyond aggregation stage) was assessed at 24 h (average of n = 3 ± SD). Statistical significance was calculated using a two-way ANOVA with Tukey test. (B) Early exposure of cells to TSA is necessary for developmental inhibition. Upper panel, schematic illustration of the experimental design. The development assay was performed as described in A, but TSA (4 μM) was added at the indicated time during development and pictures taken after 24 h. Middle panel, quantification of late structures (average of n = 3 ± SD). Statistical significance was calculated using a two-way ANOVA with Tukey test. Bottom panel, representative images. (C) TSA pre-treatment for 4 h inhibits late development. Cells were washed with KK2 and incubated with DMSO or 4 μM TSA for 4 h in KK2 in shaking suspension at 4 × 10⁶ cells/ml and subsequently washed before plating onto agar in the absence of TSA for development for another 20 h before images were taken and the percentage of late structures calculated. Data in B and C is the average ± SD of three independent repeats and statistical significance calculated using a Student's paired T-test. (D) TSA-induced changes in H3K9Ac, H3bK14Ac. Cells were washed in KK2 and developed in the presence of 4 μM TSA or DMSO vehicle control for 0–4 h at 4 × 10⁶ cells/ml in KK2 before harvesting. Acid-extracts were resolved by 18% SDS-PAGE and immunoblotted using specific antibodies as indicated. Data is presented as the mean ± SD (n = 2). The P value was calculated using linear regression. (E) TSA induces H3K4me3-directed acetylation. Cells were treated and harvested as described in D. Acid-extracts were resolved on 20% acid-urea gels and immunoblotted using anti-H3K4me3 and H3 antibodies. Relative band intensity of ladders was determined using ImageJ. H3K4me3 is shown in blue, total H3 in black. One experiment representative of three is shown. *P < 0.05; **P< 0.01; ***P < 0.001.

