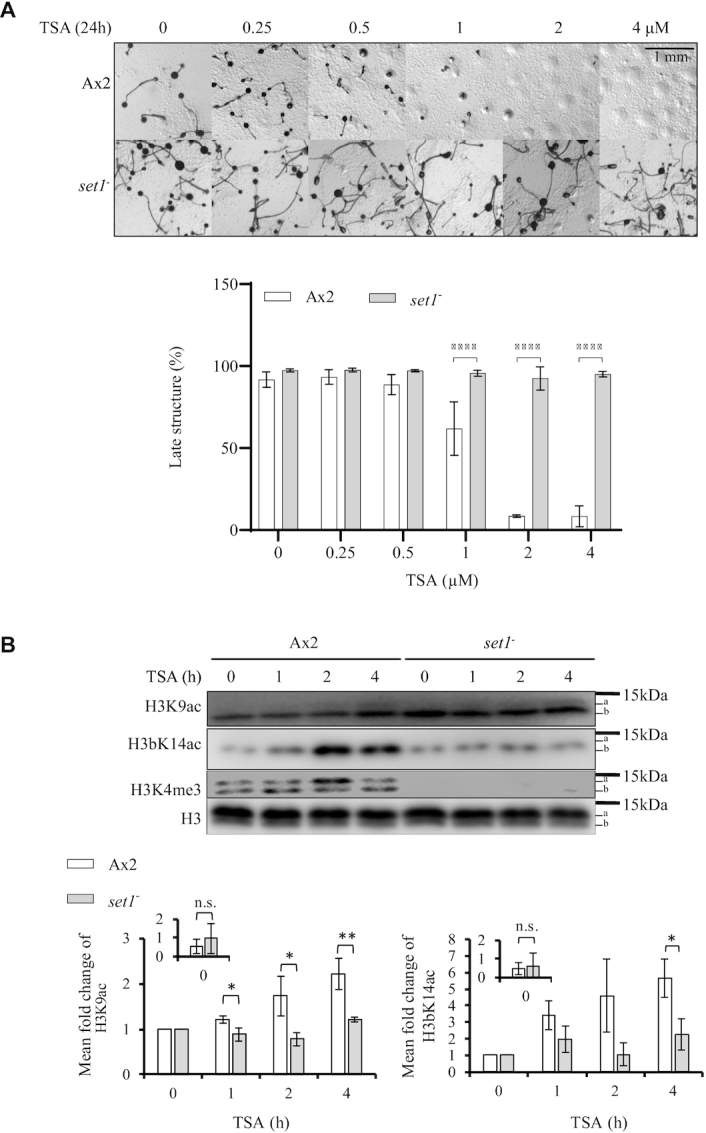
Figure 2.

Loss of Set1 delays H3K9 and H3bK14 acetylation and confers developmental resistance to TSA. (A) set1– cells are resistant to TSA during development. Ax2 and set1– cells were washed with KK2 and allowed to develop on buffered agar with increasing concentrations of TSA as described in Figure 1A. Images were taken at 24 h and representative images of three repeats presented. The percentage of late structures is shown as average ± SD (n = 3). Statistical significance was calculated using two-way ANOVA with Tukey test. (B) TSA-induced increase in H3 acetylation is delayed in set1– cells. Cells were developed in the presence of 4 μM TSA for 0–4 h in KK2 before harvesting for acid-extraction as described in Figure 1. Acid-extracts were resolved by 18% SDS-PAGE and immunoblotted using specific antibodies as indicated. Levels of H3K9Ac and H3bK14Ac relative to total H3 at 0 h in each strain was determined from three biological repeats and shown as mean ± SD in the inset chart. To evaluate the increase in levels seen in the presence of TSA, the level of modification at 0h was set as 1 and other time points expressed relative to this starting point (main bar chart). Statistical significance was calculated using a Student's paired t-test. *P < 0.05; **P < 0.01; ****P < 0.0001.
