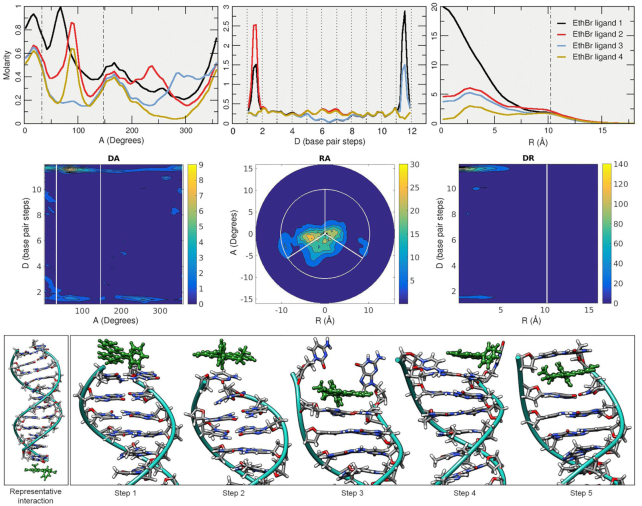
Figure 3.
Top row: 1D A, D and R plots of the ethidium ligands. The short distance in the A plot between the dotted lines represents the minor groove using the C1′ atoms angular position. The dashed line in the R plot represents the radial position of the phosphorous atoms; values are based on the Canion publication (69). Each line of the top plots represents the analysis performed in each of the four ethidium ligands. The full trajectory information with an offset of 10 frames was used for the analysis. Middle row: 2D representations for the curvilinear helicoidal information based on the ethidium ligand 1 only. Bottom row, left: selected representative interaction extracted from one of the simulations. Bottom row, right: ethidium intercalation process at the CpG base pair steps at the 5′/3′ ends of the DDD depicted by selected snapshots from the trajectory data.

