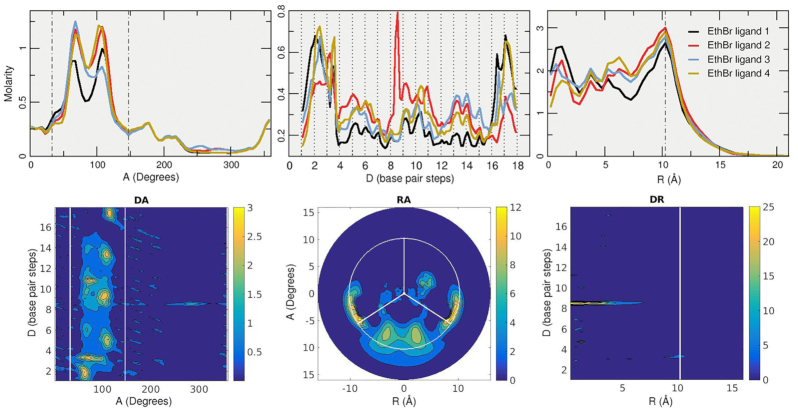
Figure 5.
Top row: 1D A, D and R plots of the ethidium ligands. The short distance in the A plot between the dotted lines represents the minor groove using the C1′ atoms angular position. The dashed line in the R plot represents the radial position of the phosphorous atoms. Bottom row: 2D representations for the ethidium ligand 2 set of trajectories (red line on the 1D plots). Molarity increases from blue to yellow.

