Figure 2.
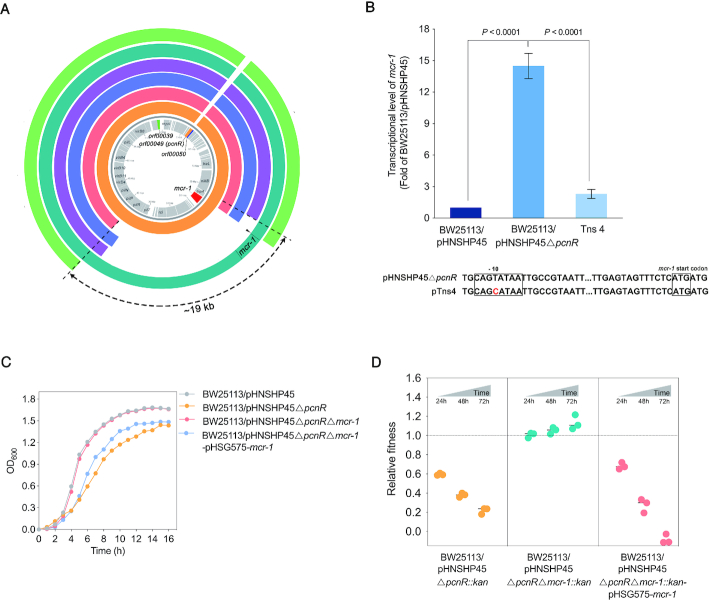
The fitness cost of pHNSHP45ΔpcnR is associated with mcr-1. (A) Comparison of the nucleotide sequence between pHNSHP45ΔpcnR and plasmids in transposon mutants. From inside to outside, coding sequences of pHNSHP45 appear on the innermost circle in grey. The second circle in orange represents the nucleotide sequence of pHNSHP45ΔpcnR. The following circles in red, blue, purple, cyan, and green represent plasmids pTns1, pTns2, pTns3, pTns4 and pTns7, respectively. The 15–19 kb regions containing mcr-1 between nikB and pilP genes are missing from pTns1, pTns2, pTns3 and pTns7 plasmids. A point mutation (shown by black triangle) was located in the -10 region of mcr-1 promoter on pTns4 plasmid. The circular BLAST Atlas was computed by the GView server (https://server.gview.ca/), and each plasmid was mapped against pHNSHP45 (GenBank accession number: KP347127). (B) Effect of point mutation (T-C) in the -10 region of promoter on the expression of mcr-1. Error bars represent the SD and P-values were calculated by One-way ANOVA test. (C) Deletion of mcr-1 restores the growth of BW25113/pHNSHP45ΔpcnR. Values represent the mean of three independent experiments. (D) Deletion of mcr-1 restore the relative fitness of BW25113/pHNSHP45ΔpcnR. E. coli BW25113 harbouring pHNSHP45ΔpcnR::kan, pHNSHP45ΔpcnRΔmcr-1::kan and pHNSHP45ΔpcnRΔmcr-1::kan-pHSG575-mcr-1 were competed with the reference strain BW25113/pHNSHP45 in vitro separately. All competitions assays were carried out with three biological replicates and the relative fitness of each strain was detected at 24, 48 and 72h.

