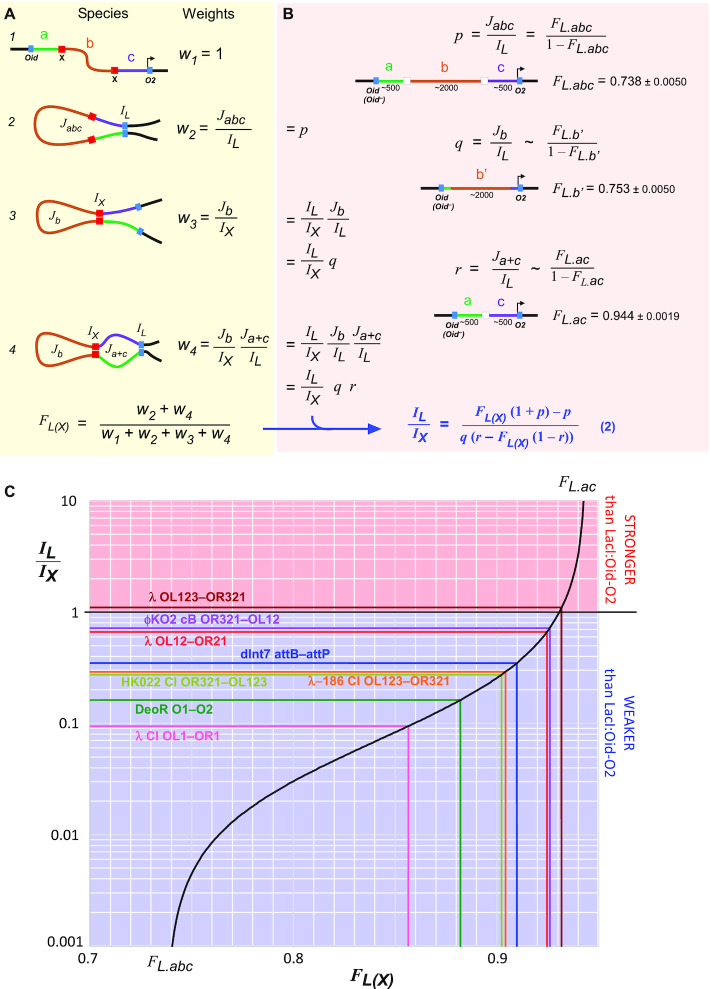
Figure 5.
Estimating looping strength relative to LacI/Oid-O2. (A) Our statistical–mechanical model for two nested DNA loops applied to the case of the loopometer reporter (see text). (B) Derivation of Equation (2), which relates IL/IX (the looping strength of the candidate protein and sites relative to LacI:Oid-O2) to loopometer measurements of FL and FL(X) and the statistical weights p, q and r for looping of particular DNA segments by LacI alone (see text). FL.abc is the mean of the eight FL values in Figure 4 (n = 8), but values for individual reporters could also be used. FL.b’ and FL.ac values (n = 32 and 28) were obtained from strains ID1290 and ID1291 or ID1292 and ID1293, respectively. Values are ± 95% confidence limits (Student's t). (C) The plot of Equation (2), using the p, q and r values of (B), showing the measured FL(X) values and derived IL/IX values of the proteins/sites tested.

