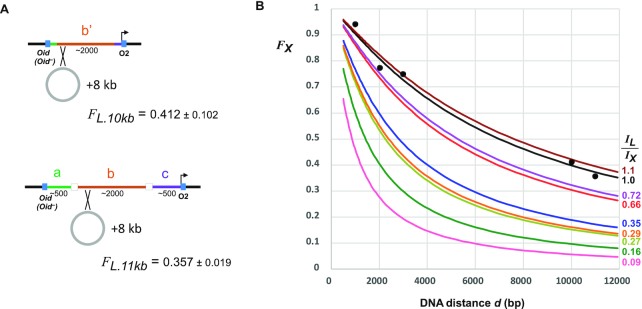
Figure 6.
Estimating fractional looping for different DNA distances. (A) Reporters with increased Oid-Plac.O2 spacings were made by integrating an 8 kb plasmid into the abc and b’ segments of reporter strains to make strains ID1318/ID1319 (abc: Oid–/Oid+) and strains ID1320/ID1321 (b’: Oid–/Oid+). FL values (± 95% confidence limits, Student's t, n = 8) were measured as in Figure 4. (B) Plot of predicted fractional looping by the candidate protein, FX, versus DNA distance, d (bp), for different values of IL/IX, using the relationships F = J/(J+I) (35) and J = 1.04 × 10⁶ × d1.15 nM (36) and assuming IL = 38.3 nM. Points are FL looping values for LacI/Oid-O2 from Figure 5 and (A) and are reasonably fitted by the FX curve for IL/IX = 1.

