Figure 4.
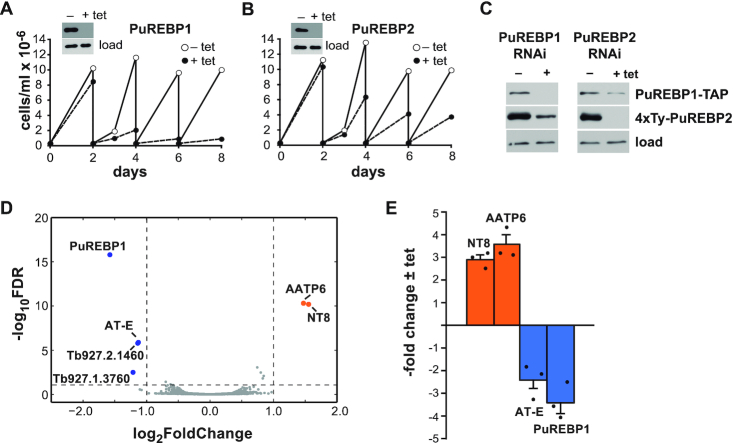
RNAi of PuREBPs and effects on growth and transcriptome. Cell lines were generated that expressed dsRNAs corresponding to PuREBP1 (A) or PuREBP2 (B) in a tetracycline-dependent fashion. Cultures were followed for up 8 days and diluted every two days as needed. Depletion of each protein was monitored by immunoblot after 48 h of tetracycline induction (insets); DRBD3 (37) served as a loading control. (C) Ablation of any PuREBP caused partial co-depletion of the other. A cell line expressing both PuREBP1-TAP and 4xTy-PuREBP2 was transfected with plasmids expressing dsRNA corresponding to either PuREBP1 or PuREBP2. Protein levels were monitored by immunoblot as above. (D) Volcano plot of differential gene expression in PuREBP1-depleted cells compared to uninduced cells. Blue dots correspond to downregulated transcripts, orange blots indicate upregulated transcripts and grey dots represent unregulated mRNAs; dashed lines show thresholds for differential abundance (|log2 fold change| > 1) and false discovery rate (FDR < 0.01). Only one paralogue of NT8 and AATP6 are shown. (E) Quantitative RT-PCR to confirm differential abundance of NT8, AATP6, PuREBP1 and AT-E transcripts upon PuREBP1 depletion by RNAi. Fold-changes are expressed as the mean ± s.e.m. (n = 3).

