Figure 1.
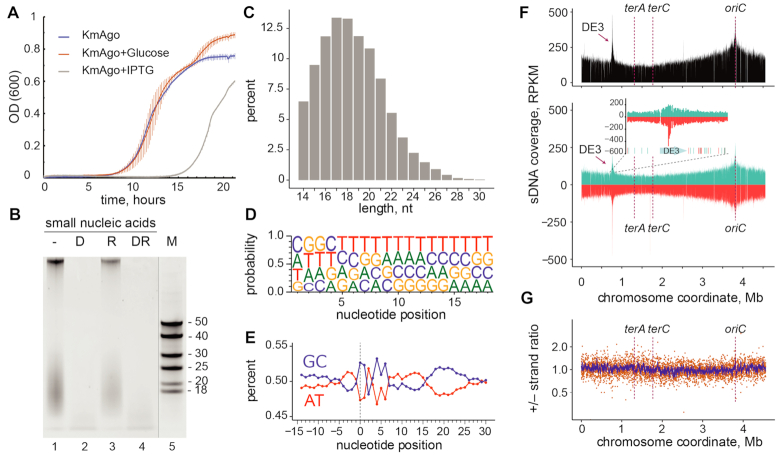
KmAgo binds small DNAs from genomic sequences during expression in E. coli. (A) Effect of KmAgo expression on cell growth. The experiment was performed in BL21(DE3) strains containing the expression vector (pET28-KmAgo) in the absence of IPTG, in the presence of Glc (to fully suppress possible leaky expression of KmAgo) and in the presence of the inducer (IPTG) (mean values and standard deviations from three biological replicates are shown). (B) Purification of KmAgo-associated nucleic acids after its expression in E. coli. Nucleic acids were treated with DNaseI (lane 2), RNase A (lane 3), both nucleases (lane 4), or left untreated (lane 1), separated by denaturing PAGE and stained with SYBR Gold. DNA length markers are shown in lane 5. (C) Length distribution of small DNAs in the sequenced libraries. (D) Frequencies of individual nucleotides at different positions of smDNAs associated with KmAgo. (E) AT/GC-content along the smDNA sequences. Nucleotide positions relative to the smDNA 5′-end are shown below the plot (negative numbers correspond to genomic DNA adjacent to the 5′-end of smDNA). (F) Genomic distribution of KmAgo-bound smDNAs mapped to the chromosome of the BL21(DE3) strain (top, the total number of smDNAs; bottom, strand-specific distribution of smDNAs; turquoise, plus strand; red, minus strand). The inset shows the genomic neighborhood of the DE3 prophage, with distribution of Chi sites in this region (turquoise, Chi sites in the plus strand; red, Chi sites in the minus strand). The numbers of smDNAs are shown in RPKM (reads per kilobase per million reads in the smDNA library). Positions of the replication origin (ori) and termination sites (terA and terC) are indicated. (G) Ratio of the smDNA densities for the plus and minus genomic strands. The ratio of RPKM values in each 1 kb window is shown in orange; the averaged ratio in the 10 kb window is shown in blue.

