Figure 3.

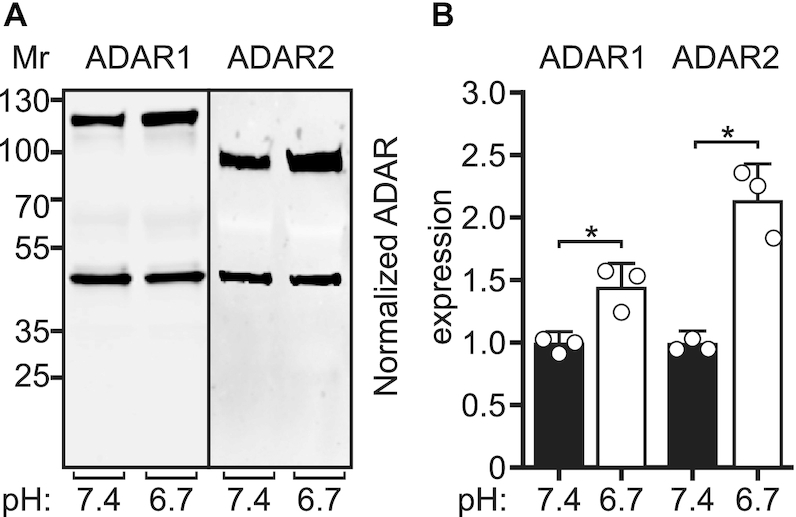
ADAR protein expression in response to acidification in HEK293T cells. (A) Representative Western blots for ADAR1 (110 kDa) and ADAR2 (80 kDa) protein expression from HEK293T cells incubated with control (pH 7.4) or acidic media (pH 6.7); β-actin (43 kDA) was used as a loading control. (B) Quantification of ADAR1 and ADAR2 protein expression normalized to the β-actin loading control is presented. Plotted values represent the means of three biological replicates (○) ± SD. Statistical significance between groups was determined using the unpaired t-test with Welch's correction; *P ≤ 0.05.
