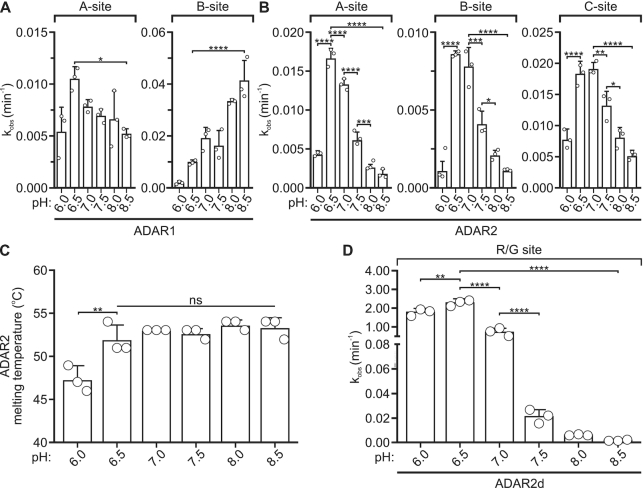
Figure 5.
Effect of varying pH on in vitro A-to-I editing. (A) Rate of in vitro ADAR1- or (B) ADAR2-mediated 5HT2C editing at half-pH intervals from 6.0 to 8.5. Plotted values represent the means of three technical replicates (○) ± SD. Statistical significance between groups was determined using one-way ANOVA with Tukey's multiple comparisons test; *P ≤ 0.05; **P ≤ 0.01; ***P ≤ 0.001; ****P ≤ 0.0001. (C) Quantification of ADAR2 melting temperature across the pH range used for in vitro editing experiments. Plotted values represent the means of three technical replicates (○) ± SD. Statistical significance between groups was determined using one-way ANOVA with Tukey's multiple comparisons test; **P ≤ 0.01; ns, not significant. (D) Rate of in vitro ADAR2d-mediated Gli1 R/G site editing. Plotted values represent the means of three technical replicates (○) ± SD. Statistical significance between groups was determined using one-way ANOVA with Tukey's multiple comparisons test; **P ≤ 0.01; ****P ≤ 0.0001.

