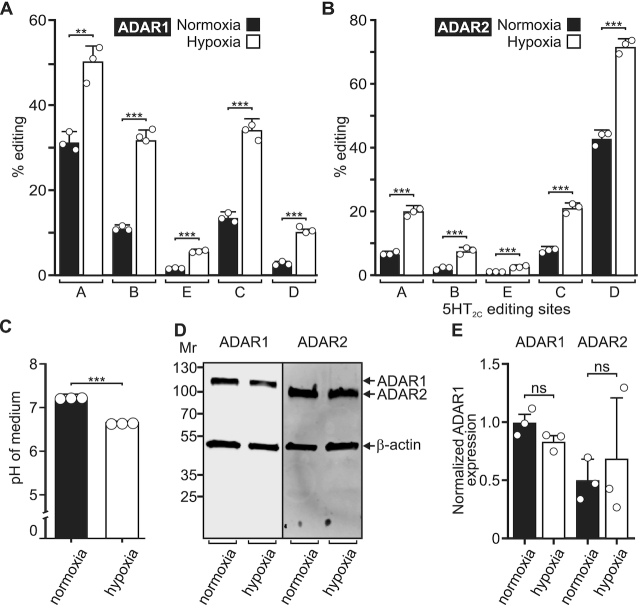
Figure 7.
A-to-I editing in response to hypoxia. (A) Quantification of the extent of ADAR1 or (B) ADAR2-mediated 5HT2C editing from HEK293T cells incubated under normoxic (20% O2) or hypoxic (1% O2) conditions. Plotted values represent the means of three biological replicates (○) ± SD. Statistical significance between groups for each 5HT2C site was determined using the Holm-Sidak t-test for multiple comparisons; **P ≤ 0.01; ***P ≤ 0.001. (C) pH of the cell culture medium following 24-h incubation of HEK293T cells under normoxic (20% O2) or hypoxic (1% O2) conditions. Means ± SD from three independent experiments (○) were compared using the unpaired t-test with Welch's correction; ***P ≤ 0.001. (D) Representative Western blots for ADAR1 (110 kDa) and ADAR2 (80 kDa) protein expression from HEK293T cells incubated under normoxic (20% O2) or hypoxic (1% O2) conditions; β-actin (43 kDA) was used as a loading control. (E) Quantification of ADAR1 and ADAR2 protein expression normalized to the β-actin loading control is presented. Plotted values represent the means of three biological replicates (○) ± SD. Statistical significance between groups was determined using the unpaired t-test with Welch's correction; ns, not significant.

