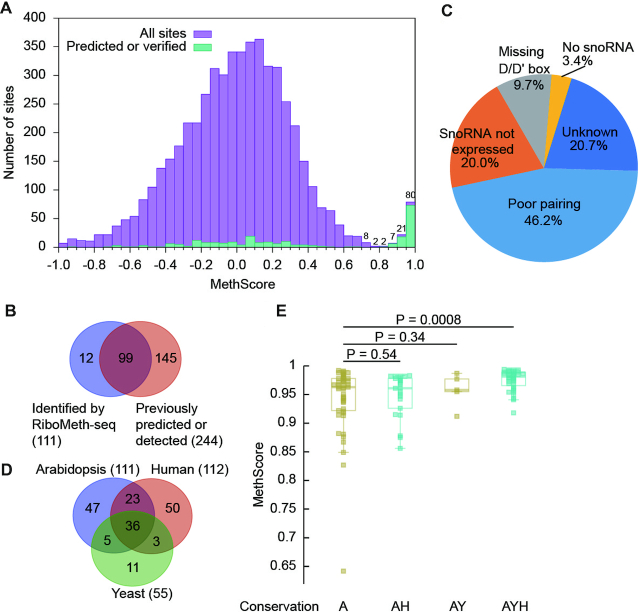
Figure 1.
RiboMeth-seq analysis of Arabidopsis cytoplasmic rRNAs. (A) Histogram of methylation scores (MethScore) for all analyzed sites in cytoplasmic rRNAs. Means of n = 3 biological replicates were counted. Sites with MethScore < -1 are not shown. Numbers of sites are labeled for the top bins. The upper boundary of each bin is inclusive and the lower boundary is not. (B) Venn diagram comparing the Nm identified by RiboMeth-seq and the previously predicted or experimentally detected methylation sites. (C) Pie chart showing possible reasons for 145 not confirmed methylation sites. (D) Venn diagram showing conservation of Nm among Arabidopsis, S. cerevisiae and human rRNAs. (E) Box plots of MethScore for Nm with different conservation. A: Arabidopsis, Y: yeast, H: human. P values are from two-tailed t-test.

