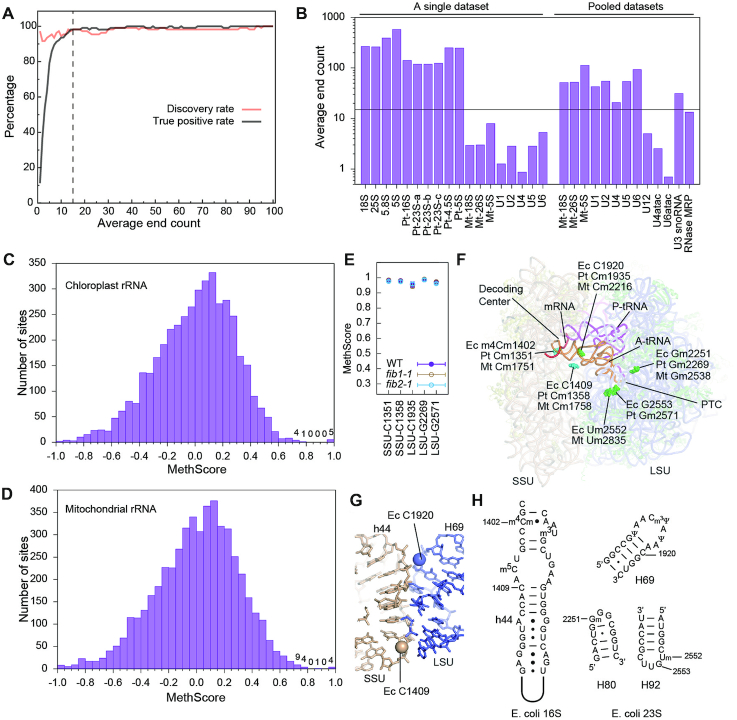
Figure 4.
Nm in Arabidopsis chloroplast and mitochondrial rRNAs. (A) Plot of discovery rate (True Positive/True) and true positive rate (True Positive/Positive) as a function of average end count (AEC). The sequencing dataset was reduced in size and used to calculate MethScores for 18S and 25S rRNAs. Sites with MethScore >0.8 are called positive. The reference true set consists of all identified Nm but 25S_U803 and the 5.8S sites. The dashed line marks AEC = 15. (B) Bar plot showing AEC for several abundant RNAs in a single RiboMeth-seq dataset (WT_rep1, 12.7 M reads) and the pooled datasets (131 M reads). The minimal level of AEC = 15 required for reliable methylation identification is shown. Pt: chloroplast, Mt: mitochondrial. (C, D) Histogram of MethScores for chloroplast rRNAs (mean of n = 3 biological replicates) (C) and mitochondrial rRNAs from the pooled datasets (D). The sites with score <–1 are not shown. Numbers of sites are labeled for the top bins. (E) MethScores are plotted as mean ± SD (n = 3) for the detected Nm in chloroplast rRNAs of WT and fib mutant plants. (F) The Nm in Arabidopsis chloroplast and mitochondrial rRNAs mapped to the structure of Thermus thermophilus 70S ribosome bound with mRNA and tRNAs (PDB code: 4V5D). Nm are shown as spheres and colored in cyan for the SSU and green for the LSU. The equivalent residues in E. coli (Ec), Arabidopsis chloroplast (Pt) and mitochondrial (Mt) rRNAs are labeled for each methylation site. PTC, peptidyl transferase center. (G) A zoom-in view of the subunit interface. The 2′-hydroxyl groups of the novel methylation sites are shown as spheres. (H) Secondary structures and modifications in E. coli rRNAs.

