Figure 5.
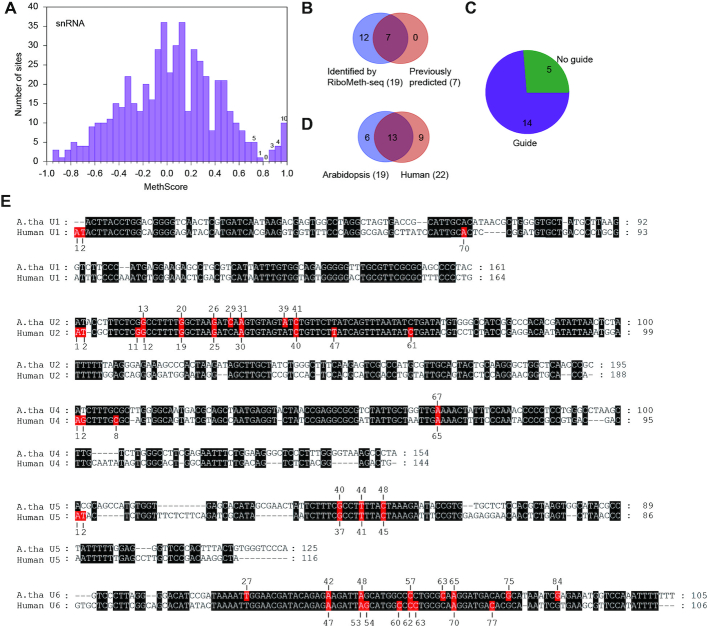
Nm in Arabidopsis snRNAs. (A) Histogram of MethScores for all analyzed sites in five snRNAs. The data were based on the pooled datasets and do not include twenty residues at the 5′ and 3′ termini of snRNAs. Gm13 and Gm20 in U2 snRNA were manually identified. The sites with MethScore < -1 are not shown. Numbers of sites are labeled for the top bins. (B) Venn diagram comparing the Nm identified by RiboMeth-seq and the previously predicted methylation sites. (C) Pie plot showing guide RNA assignment for the detected Nm in snRNAs. (D) Venn diagram showing conservation of Nm between Arabidopsis and human snRNAs. The terminal Nm in human snRNAs are not counted. (E) Alignment of Arabidopsis thaliana (A. tha) and human snRNAs. Identical residues are shaded in black. Nm are shaded in red and labeled.

