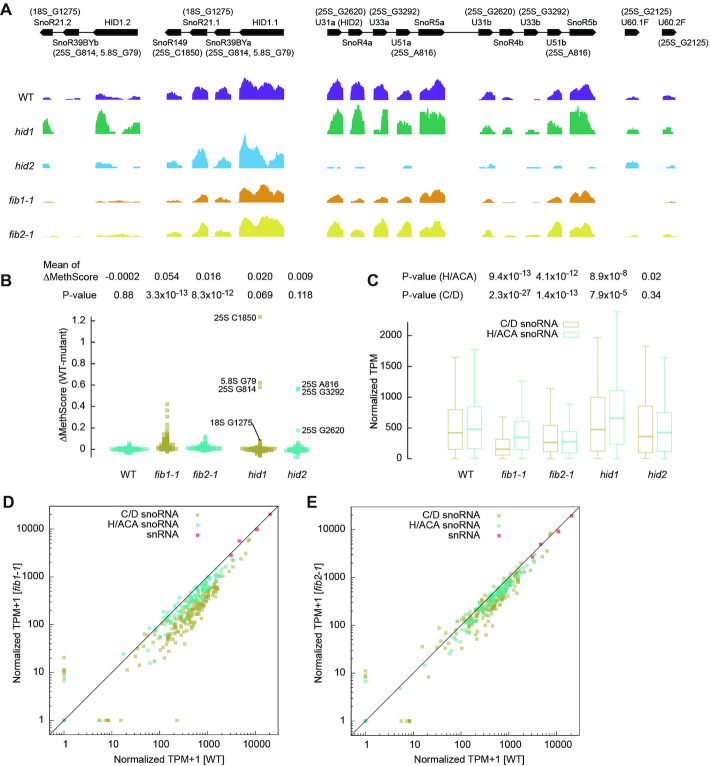
Figure 6.
rRNA 2′-O-methylation in snoRNA and FIB mutants. (A) Read coverage normalized against 18S rRNA is shown for the HID1 and HID2 snoRNA clusters, U60.1F (FIB1 intron) and U60.2F (FIB2 intron) in wild-type and mutant plants. The gene organization of snoRNA clusters and the predicted targets of C/D snoRNAs are displayed. (B) Beeswarm plot showing MethScore changes between WT and mutant plants for all identified Nm in cytoplasmic rRNAs. The targets of C/D snoRNAs affected in hid1 and hid2 are labeled. Means of MethScore changes and p-values from one-tailed paired t-test are shown. MethScores are means of n = 3 independent samples for wild-type, fib1-1 and fib2-1 and from one measurement for hid1 and hid2. The WT group was calculated between two independent wild-type samples. (C) Box plot showing abundance of C/D and H/ACA snoRNAs. Transcripts per million (TPM) were normalized against 18S rRNA (as 1 M). The central line indicates median value, while the box and whiskers represent the interquartile range (IQR) and 1.5 × IQR, respectively. P values are from two-tailed paired t-test. (D, E) Abundance of C/D snoRNAs, H/ACA snoRNAs and snRNAs in fib1-1 (D) and fib2-1 (E) is compared to that in wild-type. RNA abundance data shown in C-E are means of n = 3 independent samples for wild-type, fib1-1 and fib2-1 and from one measurement for hid1 and hid2.

