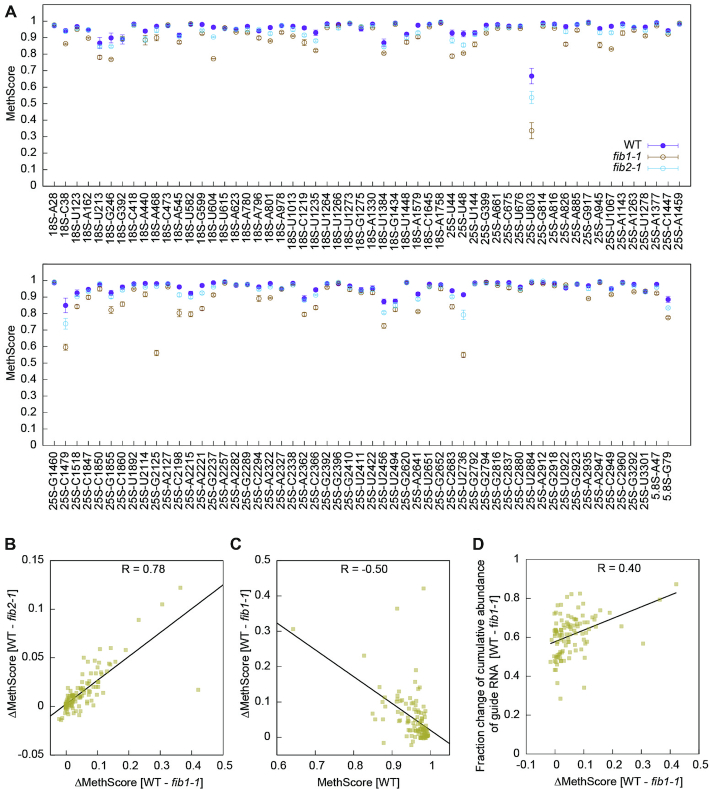
Figure 7.
Methylation changes for individual sites in fib mutants. (A) MethScores are plotted as mean ± SD (n = 3 biological replicates) for all detected Nm in WT and two fib plants. (B) Correlation (Pearson's R) between MethScore changes in fib1-1 and fib2-1. (C) Correlation between MethScore changes in fib1-1 and MethScores in WT. (D) Correlation between MethScore changes and fraction changes of cumulated abundance of guide RNAs in fib1-1. Normalized TPM of all assigned guide RNAs for a methylation site were combined to calculate fraction of change between WT and fib1-1. The values in B–D are all based on means of n = 3 biological replicates.

