
Figure 2.
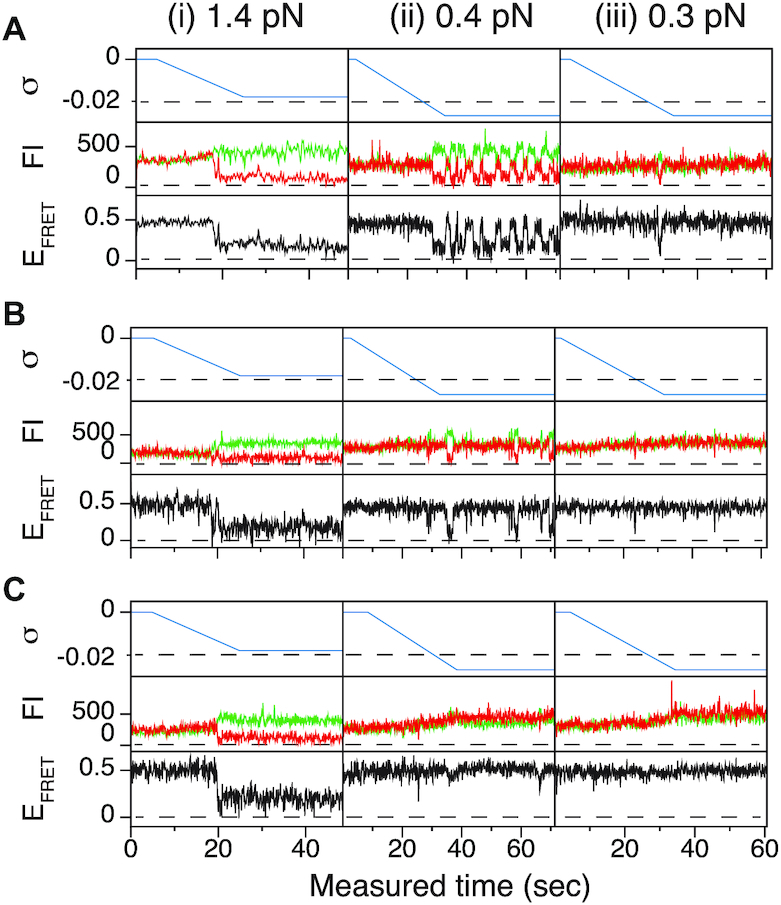
The B–Z transitions of TG repeats are sensitive to tension and torsion. FRET time traces for (A) (TG)11, (B) (TG)14 and (C) (TG)17 molecules under various levels of tension and torsion. In the left, center, and right (i, ii, and iii) panels, DNA molecules were unwound until σ reached –0.018, –0.027 and –0.027 under the tension of 1.4, 0.4 and 0.3 pN, respectively. Each panel shows the state of supercoiling (top), fluorescence intensities (FI) of donor (green) and acceptor (red) dyes (middle) and EFRET (bottom). Horizontal dashed guidelines in the top subpanels indicate σ of –0.02.