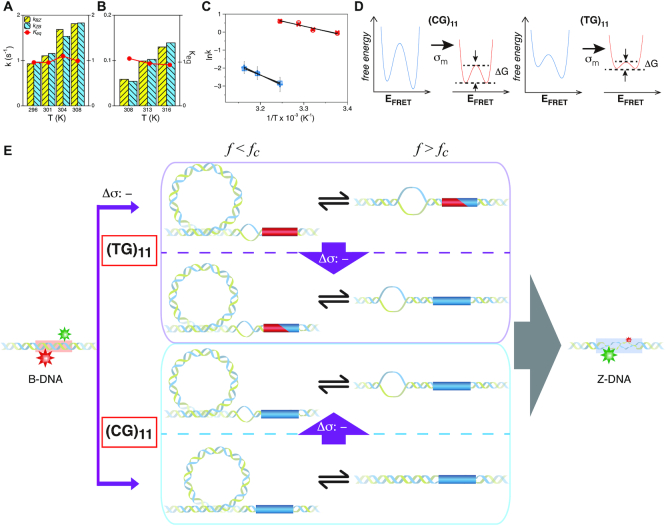
Figure 5.
Kinetics of the B–Z transition induced by supercoiling and molecular picture for the transition. Rate constants and equilibrium constants of the B–Z transition of (A) (TG)11 and (B) (CG)11 are shown for various temperatures (in Kelvin). Figure conventions are the same as in Figure 4. (C) ln k-versus-1/T graphs for (TG)11 ( : circle,
  : cross) and for (CG)11 (
 : square,
  : plus) at 100 mM NaCl. Lines are linear fits to data based on the Arrhenius equation. (D) Schematic free energy landscapes of (CG)11 (left) and (TG)11 (right) molecules in the absence (blue curve) or presence (red curve) of σm. The abscissa of the plot is EFRET and the ordinate represents the free energy (
 ) of the system. In each double-well potential, the left and right minima correspond to Z- and B-DNA states, respectively. The tension to DNA is 1.4 pN. (E) Molecular picture for the B–Z transition based on the interplay of Z-DNA, L-DNA, plectonemes and twisted B-DNA together with configurational states of CG and TG molecules under various mechanical conditions. The B-form DNA (red Core with middle EFRET) in the absence of torsional stress (far left) undergoes the transition to the Z-form DNA (blue Core with low EFRET) at sufficiently high negative torsion (far right) through various conformational states (middle) depending on type of sequence and mechanical conditions. The Z-form in TG molecules is preceded by other conformations depending on applied tension and torsion, and can compete with them beyond the tension threshold (f > fc ∼ 0.3 pN) and a certain negative torsion while the Z-form in CG molecules can form at small negative torsion over the entire range of tension applied. High force (f > fc) favors DNA bubble over plectonemes while low force (f < fc) does the opposite in unwound DNA. In the middle panel, the red and blue Cores represent the B- and Z-forms, respectively. The red-blue Core represents the Core alternating between B- and Z-forms by trading turns with the rest of the molecules. The cartoon displays a denaturation bubble (separated strands) and plectonemes (DNA gyre), respectively. ‘
 : -’ implies additional unwinding of DNA and fc indicates the critical tension for DNA buckling.

