Fig. 5.
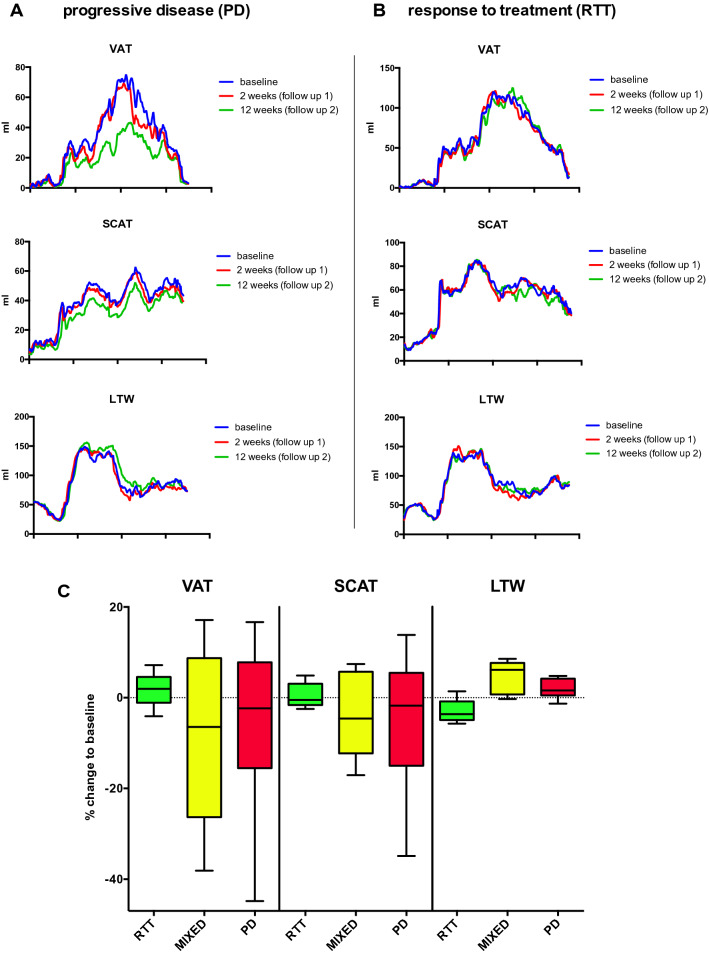
Representative examples of MRI-based whole-body segmentation and treatment-associated changes in metastatic melanoma patients treated with an immune checkpoint inhibitor. a, b Quantitative MRI measurements of visceral adipose tissue (VAT, top), subcutaneous adipose tissue (SCAT, middle) and lean tissue water (LTW, bottom) distribution in melanoma patients treated with CIT (n = 16). Examples for a melanoma patient with progressive disease (PD, a, same patient as in Fig. 4) and response to treatment (RTT, B) are given. Graphs show measurements at baseline and 2 weeks and 12 weeks into treatment outlined as the craniocaudal distribution. c Bar charts with percent change in body composition after 12 weeks of CIT therapy relative to baseline. The percent change in visceral adipose tissue (VAT), subcutaneous adipose tissue (SCAT) and lean tissue water (LTW) from baseline to the last measurement, stratified by therapeutic response, are given. No significant changes were present between groups for VAT and SCAT. Significant group differences were present for LTW (F = 9.05, p = 0.0034)

