
Fig. 1.
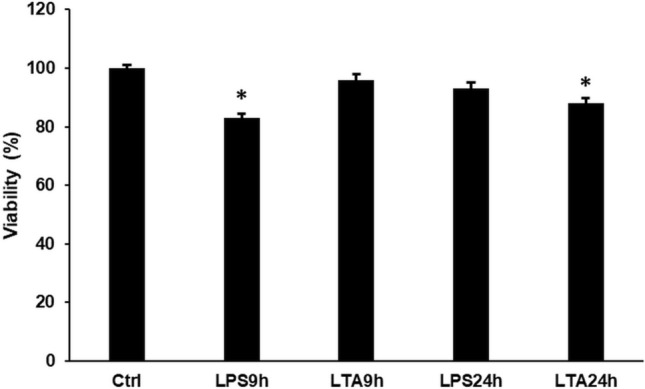
Viability measurements of LPS and LTA treated BV2 cells. Cell viability was determined using CCK-8 cell viability kit. Cell viability was calculated as percentile of the cell number of the control cells. The bars represent mean values and error bars represent standard deviation (SD) for three independent experiments (n = 3). The asterisk indicates p < 0.05 compared to the untreated control. Data was analysed by one-way ANOVA followed by Tukey’s HSD post hoc test