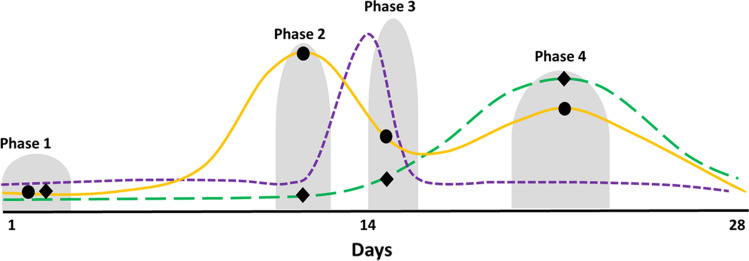
Fig. 4.
Visual overlay of the hormonal changes across an idealised 28-day menstrual cycle indicating when each phase begins and ends as described in Table 3. The solid gold line represents oestrogen the short dash purple line represents luteinising hormone and the long dash green line represents progesterone. The black dots represent the mean concentration of oestrogen during each phase and the black diamonds represent the mean concentration of progesterone in each phase

