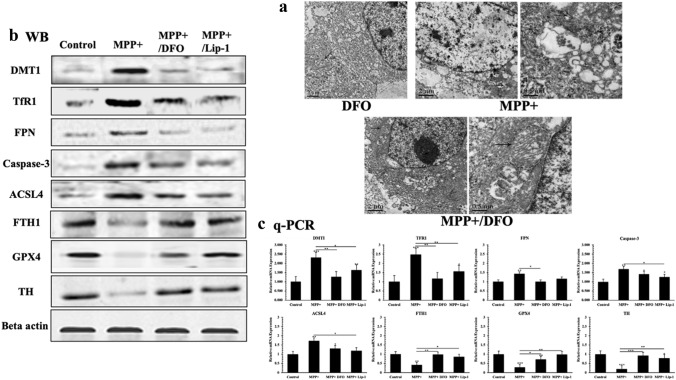
Fig. 6.
Changes of subcellular morphology. a Mitochondrial exhibited characteristic morphology changes similar to ferroptosis, like condensed mitochondrial membrane densities, reduction of mitochondrial inner membrane folds (cristae); the expression of TH, DMT1, TfR1, FPN, Caspase-3, ACSL4, FTH1, GPX4 in different groups. b Western blot analyzes; beta actin was used as an internal reference. c The real-time quantitative PCR was used to compare the mRNA expression levels of TH, DMT1, TfR1, FPN, Caspase-3, ACSL4, FTH1, Gpx4. All experiments were repeated three times and averaged. The Bonferroni method and Dunnett’s T3 method were used. The test level is α = 0.05; *P < 0.05; **P < 0.01; **P < 0.001, vs Control

