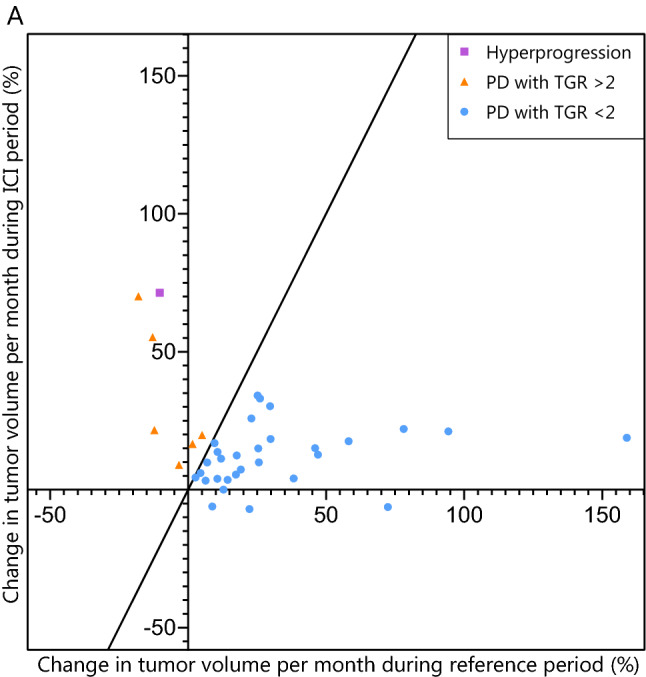
Figure 2.

Scatterplot of change in estimated tumor volume in treatment episodes with progressive disease. Pairwise comparison of TGR between the reference and ICI treatment period in the 42 episodes with progressive disease and three evaluable radiological scans. The purple dot represents an episode with hyperprogression (2-fold increase in TGR with TTF in 2 months and 50% increase in tumor burden), the orange dots represent episodes with progressive disease and a 2-fold increase in TGR and the blue dots represent episodes with progressive disease without a 2-fold increase in TGR. TGR tumor growth rate, ICI immune checkpoint inhibitor, PD progressive disease by RECIST at first evaluation, TTF time to treatment failure
