Figure 1.

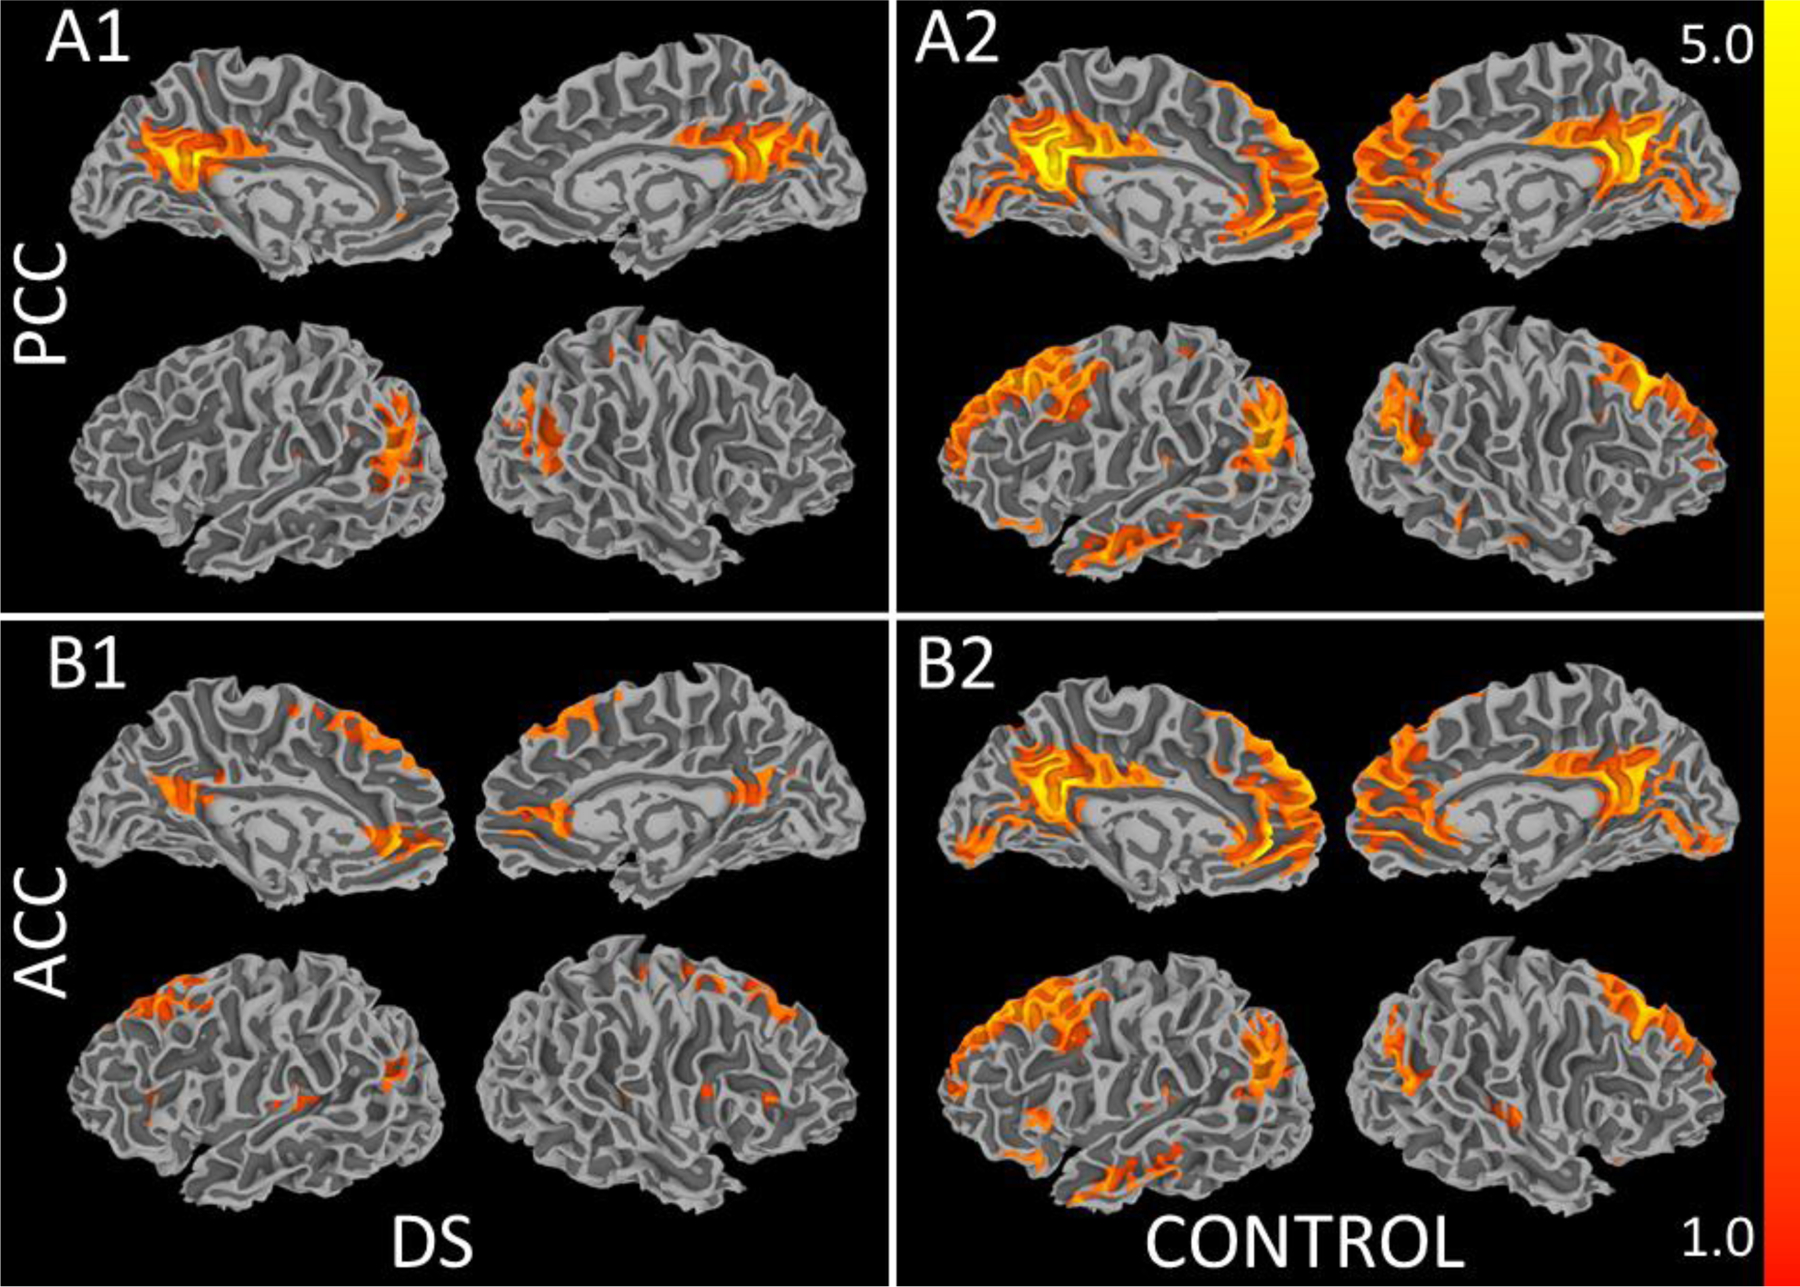
Average connectivity to the left PCC in A1. the group with DS and in A2. neurotypical controls and to the left ACC in B1. the group with DS and in B2. neurotypical controls (p < 0.001, cluster size = 200).

Average connectivity to the left PCC in A1. the group with DS and in A2. neurotypical controls and to the left ACC in B1. the group with DS and in B2. neurotypical controls (p < 0.001, cluster size = 200).