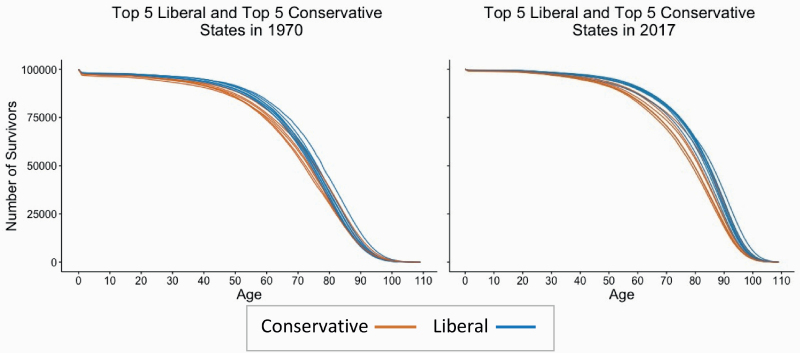
Figure 3.
Survival curves for most liberal and conservative states in 1970 and 2017. Data on mortality are from the United States Mortality Database (https://usa.mortality.org/) and data on state policy contexts are from Grumbach (2018). In 1970, conservative states were Mississippi, South Carolina, Alabama, Georgia, and Florida; liberal states were New York, New Jersey, Massachusetts, Hawaii, and Pennsylvania. In 2017, conservative states were Mississippi, South Carolina, Alabama, Georgia, and Arkansas; and liberal states were New York, New Jersey, California, Rhode Island, and Connecticut. We used life table information from 1970 and 2017, but state policy scores from 1970 and 2014 (the latest year the scores are available).

