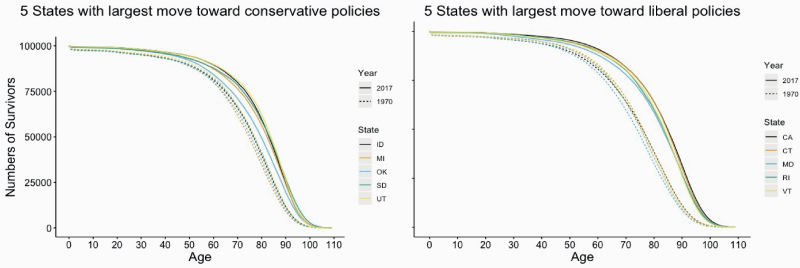
Figure 4.
Survival curves for states with largest movement in policy contexts, 1970–2017. Data on mortality are from the United States Mortality Database (https://usa.mortality.org/) and data on state policy contexts are from Grumbach (2018). We used mortality data from 1970 and 2017, but state policy scores from 1970 and 2014 (the latest year the scores are available).

