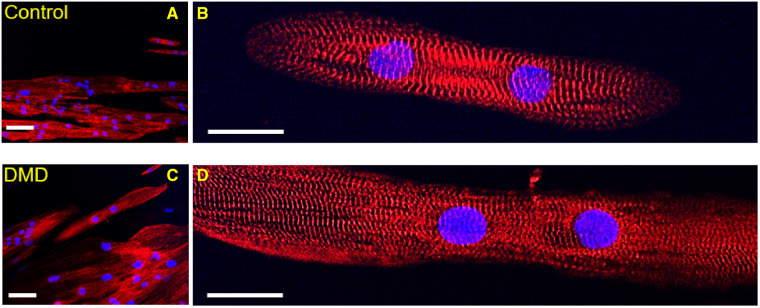
Figure 2.
DMD-CM dimensions, myofibril alignment and sarcomere length. Representative images of Control- and DMD-CMs stained for Z-bands (α-actinin, red) and nuclei (DAPI, blue) for measuring cell dimensions and myofibril organization at 20× and 60× of magnification images of control- (A, B) and DMD-CMs (C, D). Quantitative analysis are reported in the results: cellular cross section and cell diameter (ncontrol= 159, nDMD= 135); myofibril alignment index (ncontrol= 20, nDMD= 30). Resting sarcomere length (SL) (ncontrol= 20, nDMD= 32, P = 0.88). P-value was estimated by one-way ANOVA with Tukey post hoc test. N = 3 per cell line. Scale bars equal to 20 µm for (A) and (C) and 40 µm for (A), (D).

