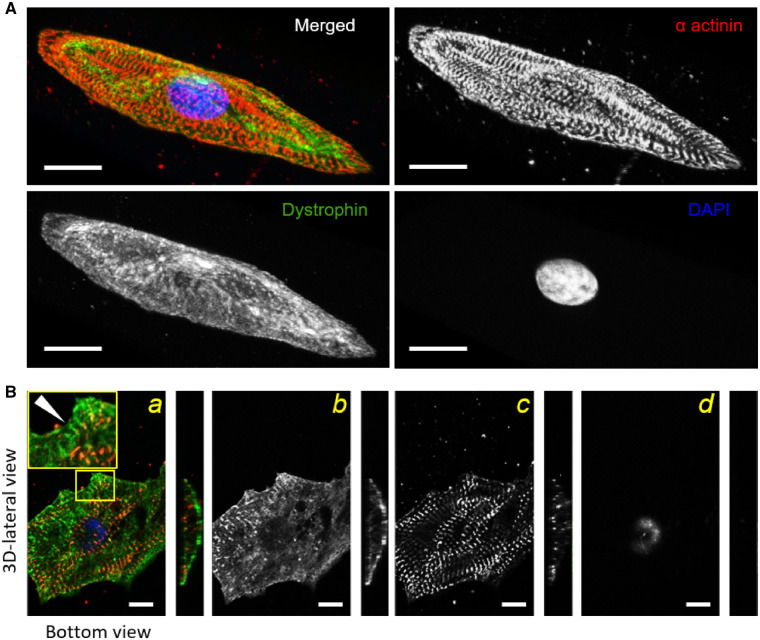
Figure 7.
Myofibril alignment and dystrophin network during nanopatterned-mediated maturation. Confocal images of control-(hiPSC)-CMs cultured on the nanogrooved substrates. (A) Control-CMs were stained with antibodies against Z-bands (α-actinin, red), dystrophin (green) and nuclei (DAPI, blue). Representative 3D reconstructions showed clear myofibril alignment quantified by fast Fourier transform (FFT) analysis. Dystrophin network formation occurred early (40 p.d. days) and covered the entire sarcolemma. (B) The bottom view of a hiPSC-CM showed dystrophin distribution (green) in a bi-dimensional view (a). The yellow-outlined blow-up shows an area of cell edge with dystrophin clusters and the same periodicity of Z-bands (a). Black and white panels show single staining of dystrophin (b), α-actinin (c), and DAPI (d). Dystrophin domains juxtaposed α-actinin staining (white arrowhead, left panel). For this analysis, the number of 3D-cell reconstruction was 12. Scale bars equal to 20 µm. One-way ANOVA with Tukey post hoc test.

