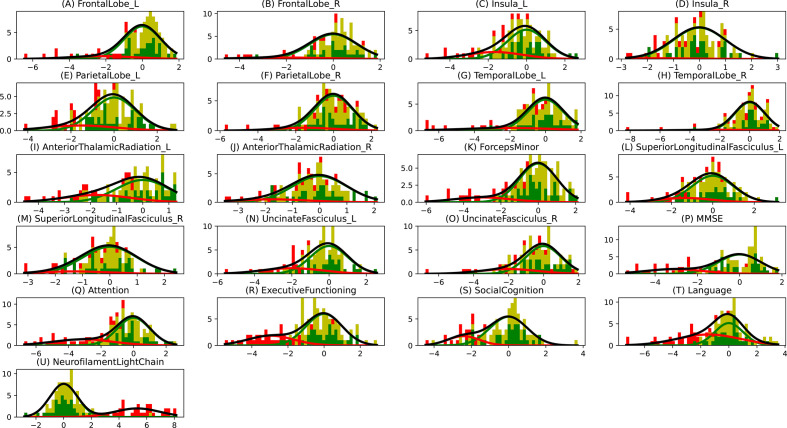
Figure 2.
Gaussian mixture modelling (GMM) distributions. The histogram bins are divided in three colours, where the green part shows the proportion of non-carriers, the yellow part shows the proportion of presymptomatic carriers and the red part shows the proportion of symptomatic carriers. The Gaussians shown here are the ones that were estimated using GMM, where the green Gaussian is the normal one estimated using non-carriers and the red Gaussian is the abnormal one estimated using the carriers. The amplitudes of these Gaussians are based on the estimated mixing parameter. The grey curve shows the total estimated distribution, which is the summation of green and red Gaussians.

