
Fig. 4.
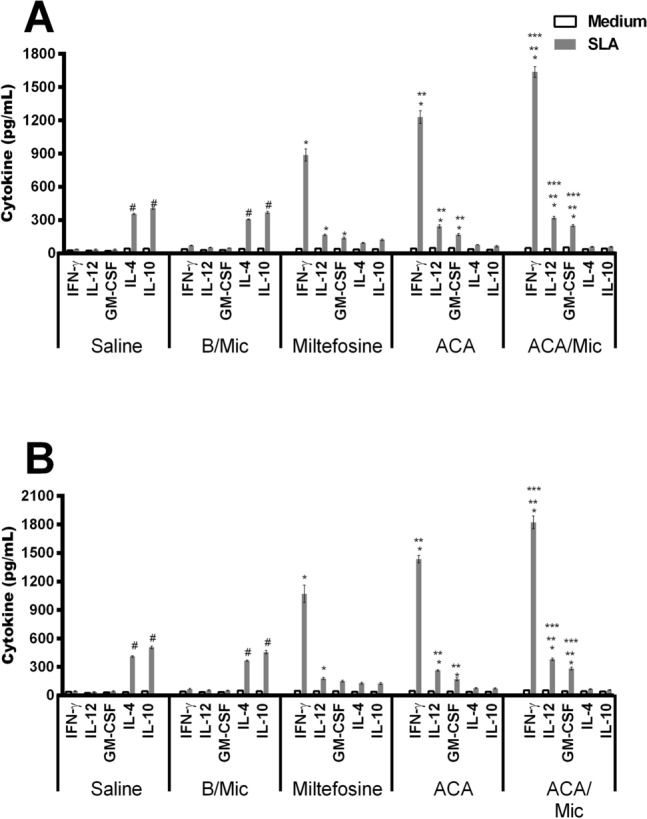
Analysis of cytokine production by capture ELISA technique. L. infantum-infected mice (n = 12 per group) were treated with saline, B/Mic, Miltefosine, ACA or ACA/Mic and their spleens removed, one and 15 days post-therapy. Spleen cells were unstimulated (medium) or stimulated with L. infantum SLA (50 μg/mL), for 48 h at 37 °C in 5% CO2. IFN-γ, IL-4, IL-10, IL-12p70 and GM-CSF levels were measured in the cell supernatants by capture ELISA, one (a) and 15 (b) days post-treatment. Bars indicate the mean ± standard deviation of the groups. (*) indicate statistically significant difference in relation to the saline and B/Mic groups (P < 0.05). (**) indicate statistically significant difference in relation to the Miltefosine group (P < 0.05). (***) indicate statistically significant difference in relation to the ACA group (P < 0.05). (#) indicate statistically significant difference in relation to the Miltefosine, ACA and ACA/Mic groups (P < 0.05)