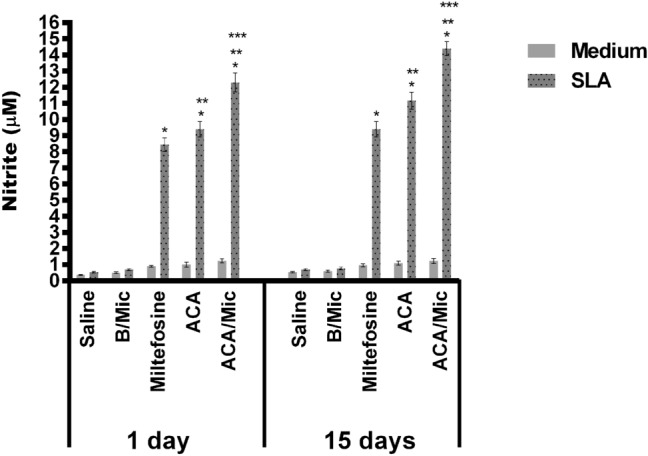
Fig. 5.

Evaluation of nitrite secretion by Griess reaction. The cellular supernatants used to quantify cytokines (Fig. 5) were also employed to evaluate nitrite production. Bars indicate the mean ± standard deviation of the groups. (*) indicate statistically significant difference in relation to the saline and B/Mic groups (P < 0.05). (**) indicate statistically significant difference in relation to the Miltefosine group (P < 0.05). (***) indicate statistically significant difference in relation to the ACA group (P < 0.05)
