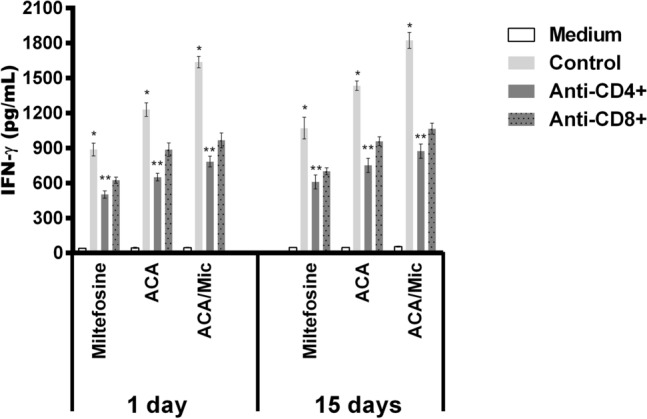
Fig. 6.

Evaluation of IFN-γ production by T-cell subtypes. Splenocytes (5 × 10⁶/mL) of the Miltefosine-, ACA- or ACA/Mic-treated mice were unstimulated (Medium), stimulated with L. infantum SLA (50 μg/mL; Control) or stimulated and incubated with anti-CD4 (GK 1.5) or anti-CD8 (53–6.7) monoclonal antibody (5 μg each; Pharmingen®, USA), for 48 h at 37 °C in 5% CO2. In all cases, cell supernatants were collected after incubation and used to quantify IFN-γ by capture ELISA. (*) indicate statistically significant difference in comparison to the use of anti-CD4 and anti-CD8 monoclonal antibodies (P < 0.05). (**) indicate statistically significant difference in comparison to the use of anti-CD8 monoclonal antibody (P < 0.05)
