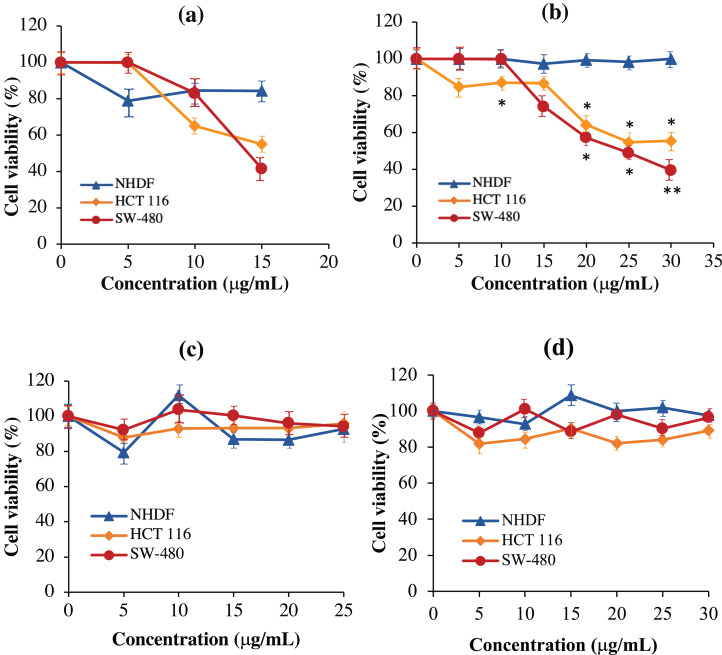
Figure 8. Normalized cell viability (%) of NHDF, HCT 116 and SW-480 cells treated with recombinant immunotoxins following 48-h of exposure as determined by MTT cytotoxicity assays.
NHDF (blue line), HCT 116 (orange line), and SW-480 (red line) cells were plated at a density of 1 × 10⁴ cells/well and treated with (A) scFv-mHALT-1, (B) mHALT-1-scFv, (C) mHALT-1 and (D) anti-mKRAS G12V-34 scFv. Each point represents the mean ± standard deviation of three replicates, where significant differences were denoted as p-value < 0.05 (*) and <0.01 (**) when compared against NHDF treated cells.

