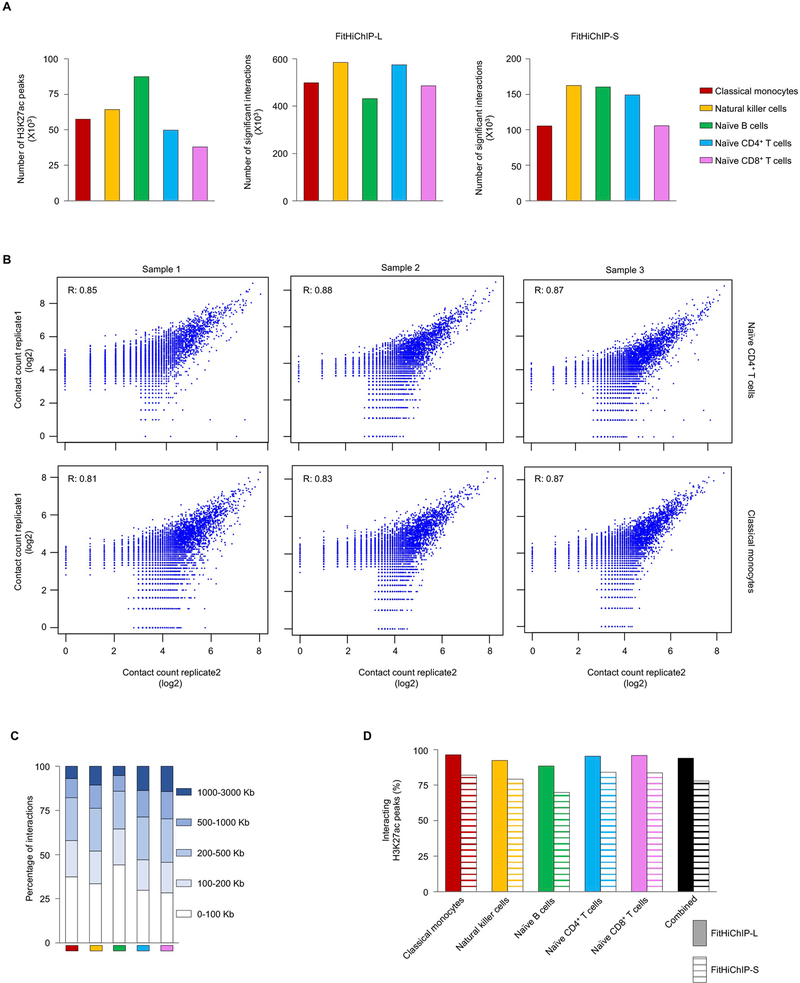
Extended Data Fig. 1 |. Active cis-regulatory interaction maps in human immune cell types from DiCe, Related to Fig. 1.
a, The number of H3K27ac ChIP-seq peaks detected in each cell type (left panel); center and right panel shows number of significant cis-regulatory interactions using two different background models (FitHiChIP-L and FitHiChIP-S, see Methods) from 70 million unique paired-end reads for each type. b, Correlation of log transformed HiChIP contact counts for assessing the reproducibility between two replicates of the same donor for naïve CD4+ T cells (top, n=3) and for classical monocytes (bottom, n=3). c, The distribution of genome-wide interaction distances for active cis-regulatory elements in each cell type. d, Percentage of all H3K27ac peaks with long-range (>10 Kb) interactions (FitHiChIP-L and FitHiChIP-S) identified using two different background models.

