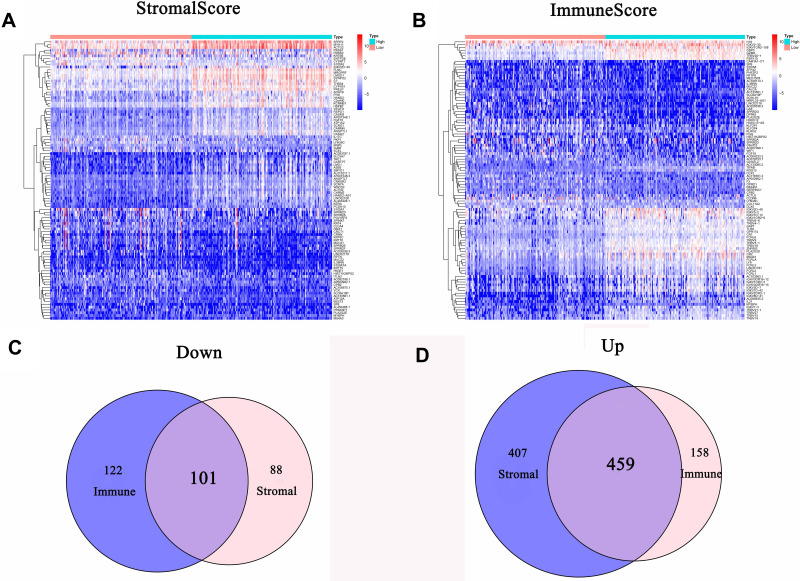
Figure 4.
Gene expression profiles of GC patients with different stromal and immune scores. (A) Heatmap of DEGs between the stromal high-score and low-score groups. (B) Heatmap of DEGs between the immune high-score and low-score groups. (C) Venn diagram of commonly downregulated DEGs in the stromal and immune score groups. (D) Venn diagram of commonly upregulated DEGs in the stromal and immune score groups.
Abbreviations: GC, gastric cancer; DEGs, differentially expressed genes.

