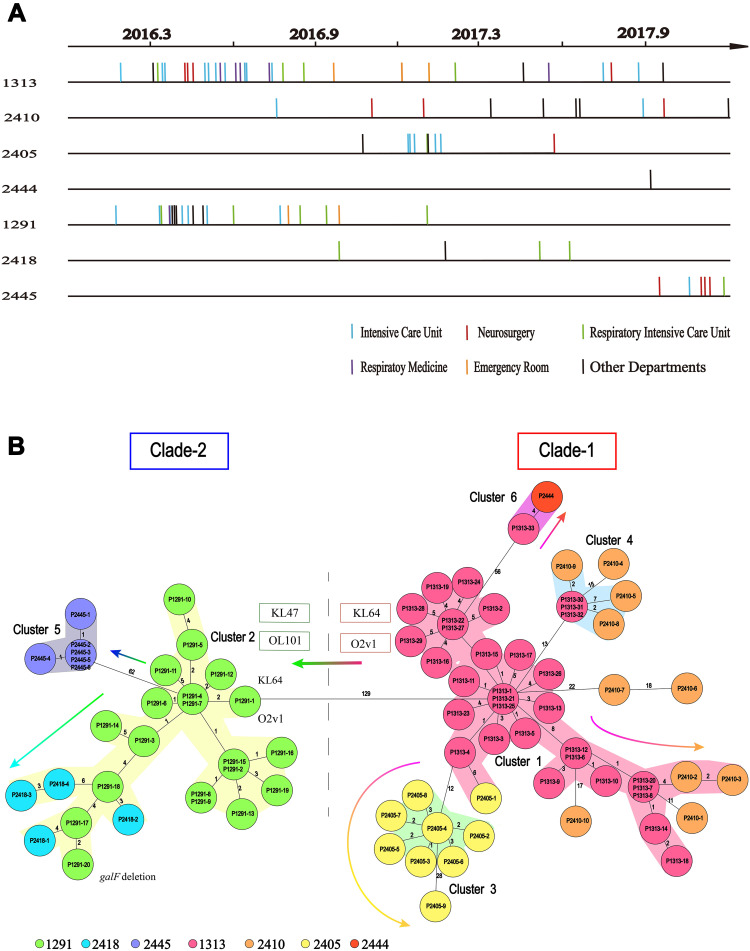
Figure 2.
Timelines of the CT type isolates in the ST11 group, and the evolutionary relationships among these isolates. (A) Sampling dates for each isolate. Vertical lines represent the isolates in each CT group. There are 33, 10, 9, 1, 20, 4 and 6 isolates in the CT1313 (P1313-1 to P1313-33), CT2410 (P2410-1 to P2410-10), CT2405 (P2405-1 to P2405-9), CT2444 (P2444), CT1291 (P1291-1 to P1291-20), CT2418 (P2418-1 to P2418-4), and CT2445 (P2445-1 to P2445-6) group, respectively. (B) Minimum spanning tree based on cgMLST scheme analysis of the different CT types in the ST11 group of carbapenemase-producing K. pneumoniae. Each circle represents the isolates belonging to the corresponding CT type, based on the sequence analysis of 2358 cgMLST target genes. The code in each circle is the case serial number. The numbers on the branches represent the number of alleles between each pair of genes. The cluster distance threshold is 15. The arrows indicate evolution direction.

