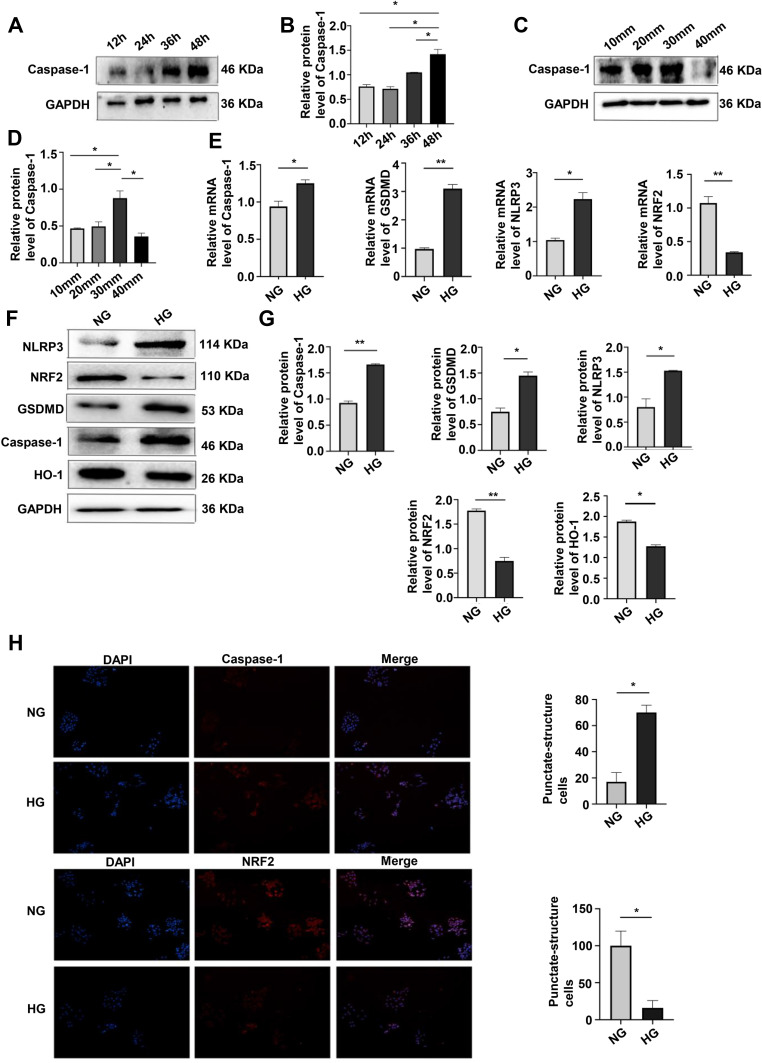
Figure 1.
Effects of culturing time and glucose concentration on pyroptosis and OS. (A and B) Western blotting of caspase-1 expression (pyroptosis) after 12, 24, 36, and 48 h of culture showed the highest level was at 48 h. *P <0.05. (C and D) Western blotting of caspase-1 expression after 48 h of culture at glucose concentrations of 10, 20, 30, 40 mmol/L, showing the highest level at 30 mmol/L. *P <0.05. (E) mRNA expression of caspase-1, GSDMD, NLRP3 and NRF2 at NG and HG by qRT-PCR. *P <0.05, **P <0.01. (F and G) Levels of caspase-1, GSDMD, NLRP3, NRF2, HO-1, in HG treatment by Western blotting. *P <0.05, **P <0.01. (H) Immunofluorescence assays of caspase-1, and NRF2 were performed following the induction of HG. *P <0.05.

