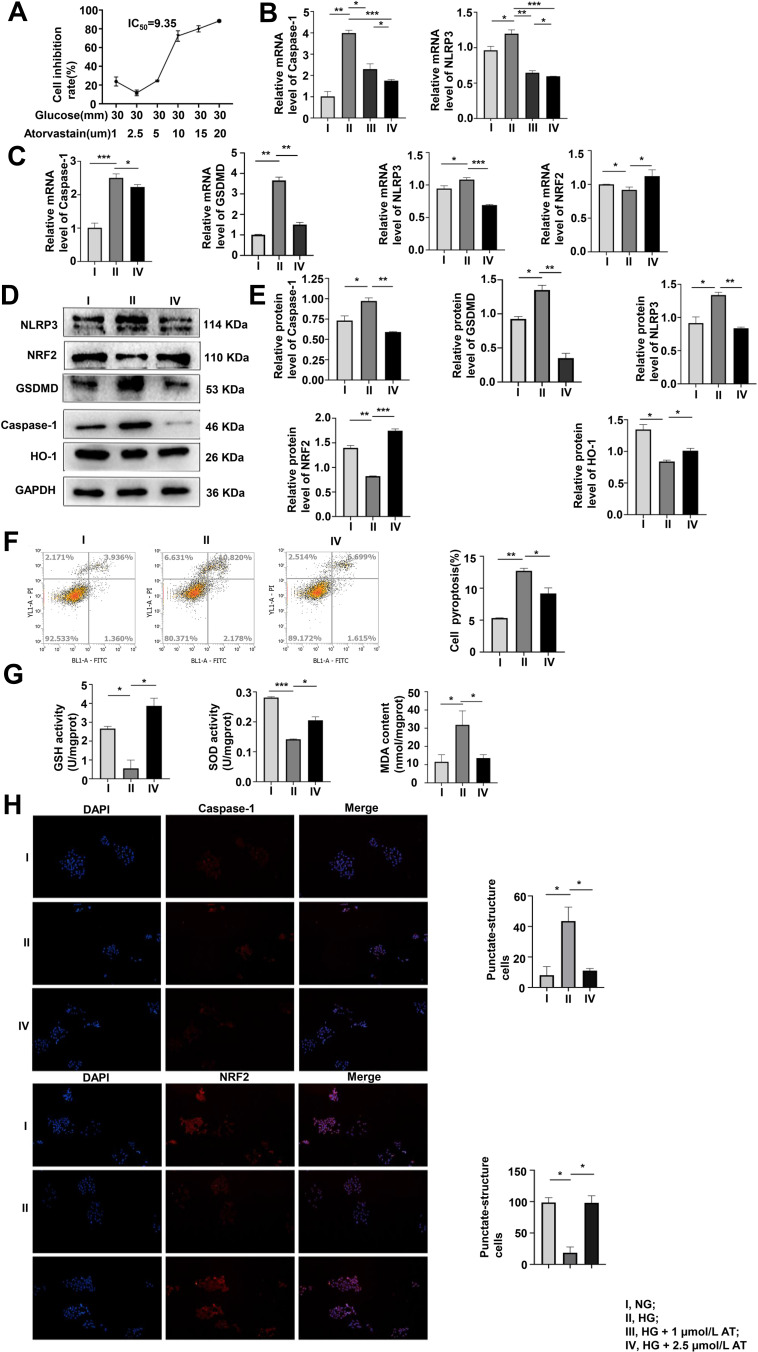
Figure 2.
The optimal concentration of AT and its effects on pyroptosis and OS. (A) Pyroptosis inhibition was assayed by CCK-8 after 48 h of culture in HG with 1, 2.5, 5, 10, 15, or 20 µmol/L AT. (B) Pyroptosis assayed by qRT-PCR of caspase-1 expression in NG, HG and HG with 1 or 2.5 µmol/L AT showed that pyroptosis and OS improved more significantly at an AT concentration of 2.5 µmol/L. *P <0.05, **P <0.01, ***P <0.001. (C–E) Pyroptosis and OS in cells treated with NG, HG and AT were assayed by qRT-PCR and Western blotting. *P <0.05, **P <0.01, ***P <0.001. (F) Flow cytometry of pyroptosis after the HG and AT treatment. *P <0.05, **P <0.01. (G) GSH, SOD, and MDA assays of cell antioxidant, oxygen free-radical scavenging, and the severity of free-radical attack. *P <0.05, ***P <0.001. (H) Immunofluorescence assays of caspase-1, and NRF2. I, NG; II, HG; III, HG + 1 µmol/L AT; IV, HG + 2.5 µmol/L AT. *P <0.05.

