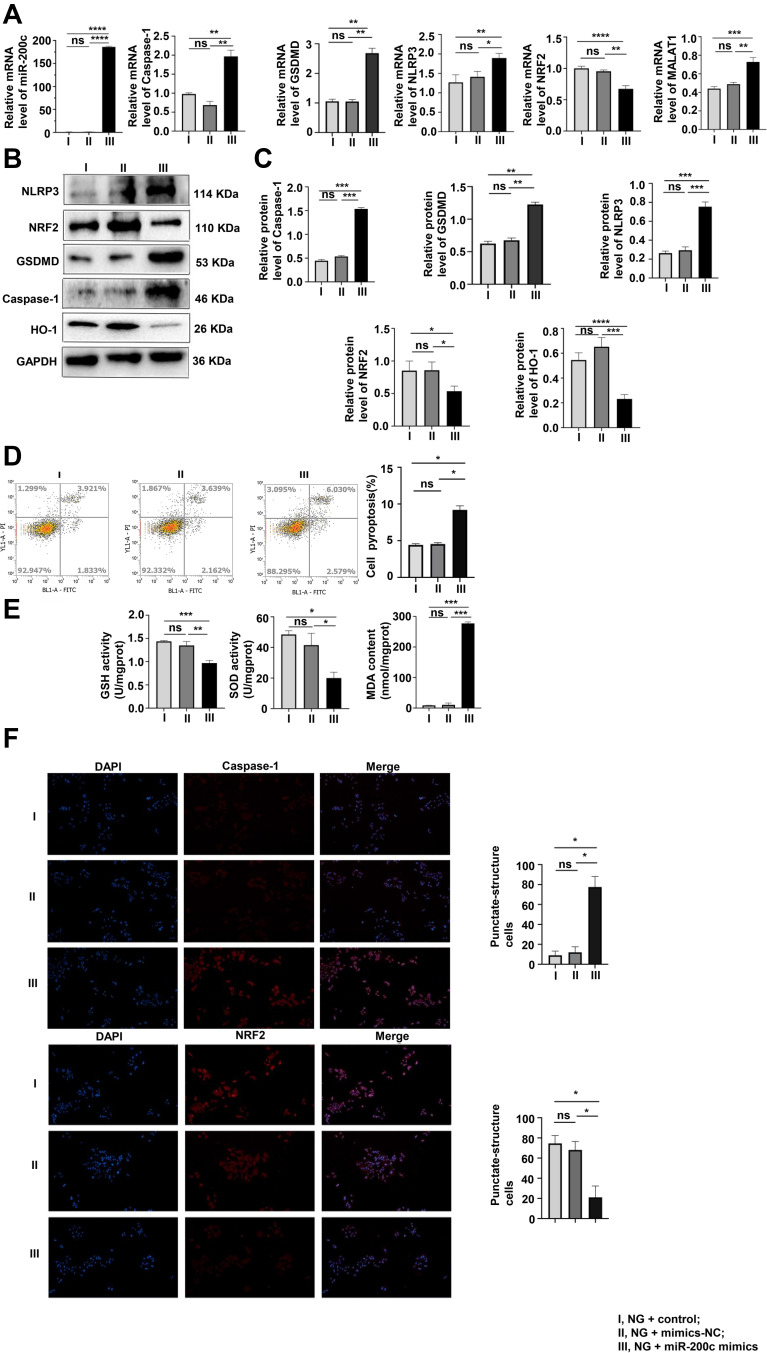
Figure 4.
Interference of miR-200c reversed pyroptosis and OS in MPC-5 cells. (A–C) As shown by qRT-PCR and Western blotting results, the levels of pyroptosis and OS were detected. *P <0.05, **P <0.01, ***P <0.001, ****P <0.0001, ns, non significant. (D) After the interference of miR-200c, the pyroptosis rate was analyzed by flow cytometry. *P <0.05, ns, non significant. (E) The results of GSH, SOD and MDA levels were consistent with others above. *P <0.05, **P <0.01, ***P <0.001, ns, non significant. (F) Levels of caspase-1, and NRF2 in cells were assayed by immunofluorescence. I, NG + control; II, NG + mimics-NC; III, NG + miR-200c mimics. *P <0.05, ns, non significant.

