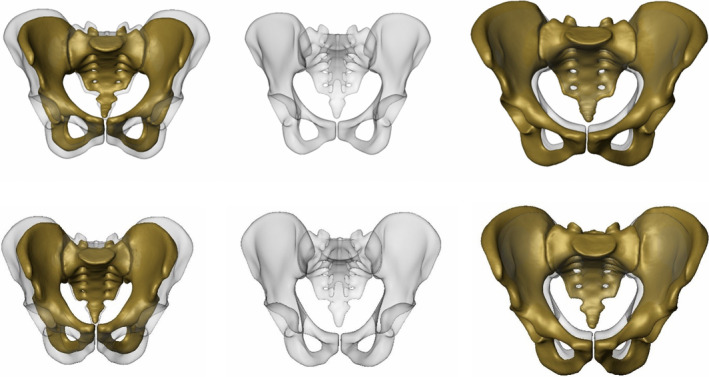
FIGURE 1.

CT‐based 3D statistical models of European females (top row) and males (bottom row) with PC 1 predominantly displaying size variation: Anteroposterior views with mean models (semi‐transparent grey) and with PC 1 models −3 SD (left) and +3 SD in yellow (right)
