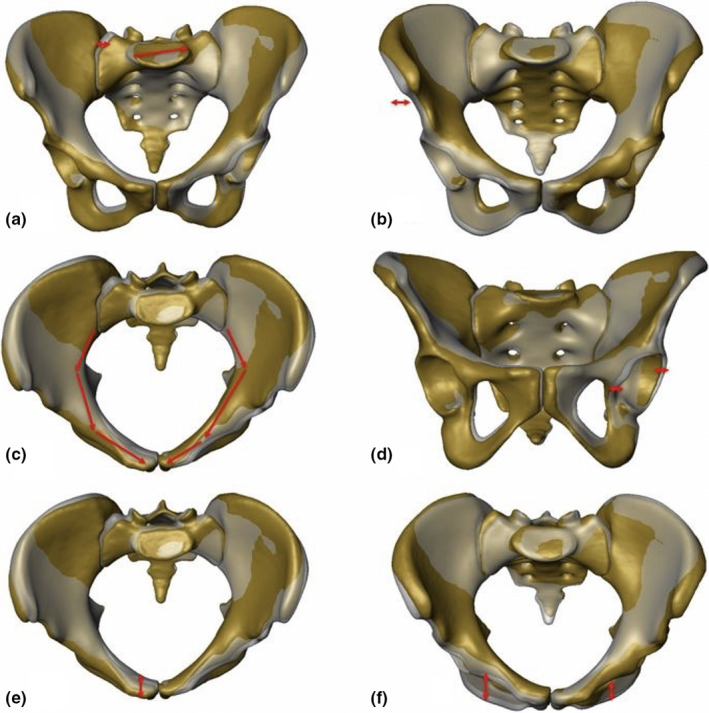
FIGURE 3.

CT‐based 3D statistical model and PCA of the European females with PC 7 to illustrate the six distinct APRs and locations (mean model (semitransparent grey), PC 7 −3 SD and +3 SD models (yellow) and red arrows). (a) PC 7, ‐3 SD: anteroposterior view, red arrows showing asymmetry of the sacrum. (b) PC 7, +3 SD: anteroposterior view, red arrow showing asymmetry of the iliac crest. (c) PC 7, ‐3 SD: inlet view, red arrows showing asymmetry of the pelvic brim. (d) PC 7, ‐3 SD: outlet view, red arrows showing asymmetry of the acetabulum. (e) PC 7, ‐3 SD: inlet view, red arrow showing asymmetry of the pubic symphysis. (f) PC 7, +3 SD: inlet view, red arrows showing asymmetry of the inferior pubic ramus
